Issue
When troubleshooting server issues, it can be helpful to look at the logs that are recorded within the Automation Server.
Product Line
EcoStruxure Building Operation
Environment
- Building Operation Automation Server
- Building Operation Automation Server Premium
- Building Operation Automation Server Bundled
Cause
Within the Automation Server logs are many records that are logged as a part of normal operations and unexpected events.
Resolution
Automation Server:
Automation Server error logs can be retrieved using Workstation, Device Administrator, or WebStation. Device Administrator can be used in case of crash information is required, ex. dump files, or if the Automation Server is not accessible via WebStation or WorkStation.
- Workstation:
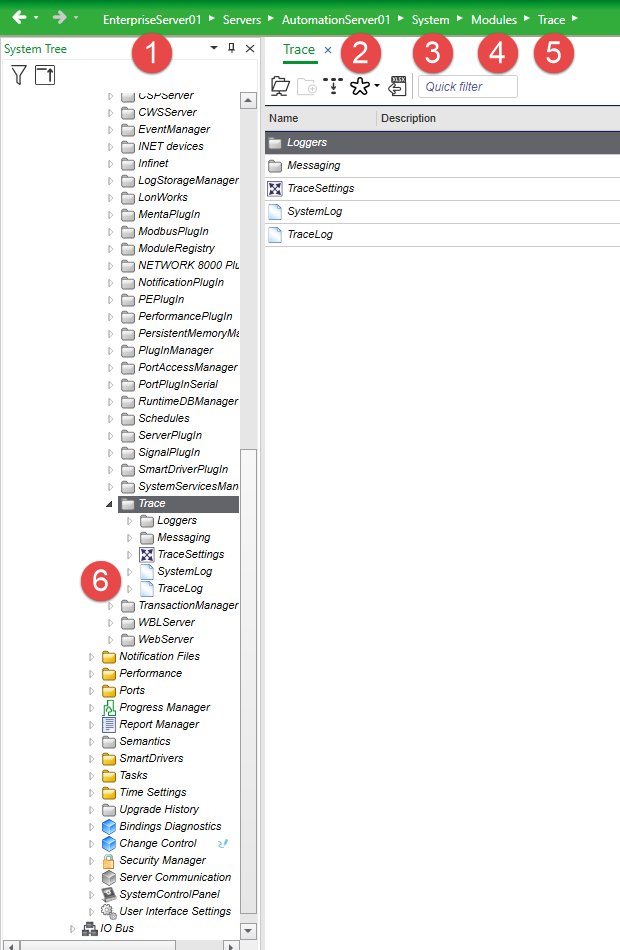
- Connect to EBO system with EBO WorkStation.
- Select the target Server
- Expand the System folder
- Expand the Modules folder
- Expand the Trace folder and see Trace Settings
- For EBO 3.1 or higher,
- Double-click both Trace Log and System Log to open separately
- Double-click both Trace Log and System Log to open separately
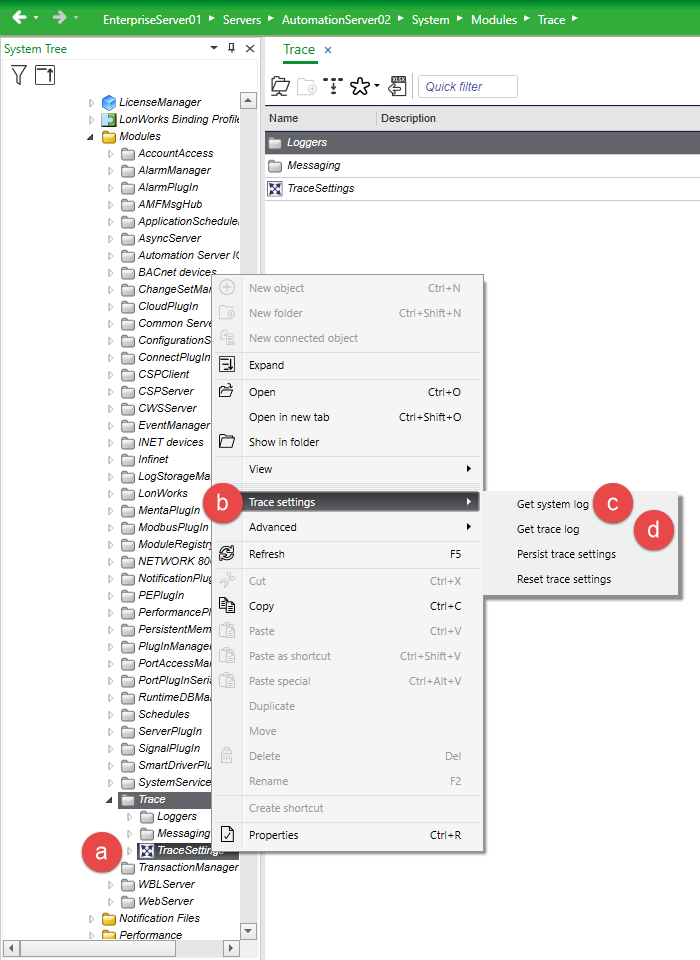
- For EBO 3.0 and lower, including SBO 1.x
- Right-click in Trace Settings
- Select Trace Settings in the menu
- Select Get System Log
- Repeat to select Get Trace Log
- Device Administrator:
- Follow this WebHelp article: Getting Automation Server Debug Information
- If requested to retrieve a core dump, use this method to retrieve the Device Administrator Debug Information zip file. Then perform the following to make sure the zip file contains a core dump with a relevant timestamp for the event being investigated.
- Open Zip
- Open the folder containing the server name and IP address
- Open Server folder
- One should see file(s) with filename in this format core_dump_<Serial Number>_nsp_servers_<Timestamp>.tgz
- WebStation:
EBO 4.0 (2022) and higher
- NOTE: You may have to enter Private Browsing mode to disable extensions, as you may see a blank page when viewing logs.
- Ensure credentials used are for a local 'admin' user or have access to the ~/System folder of the EBO Server you are connected.
- Click the 3-bar menu to navigate
- Select System, then Modules, then Trace
- One will see System Log and Trace Log in the menu, and clicking on System Log or Trace Log will open them in a new tab. NOTE: Please be patient as it may take some time to transfer the file.
- Once you see text in the tab, right-click on a blank area and select Save Page As... (Firefox) or Save As... (Chromium-based browser). It should recommend saving as SystemLog.txt or TraceLog.txt automatically; however, to be helpful, please add the EBO Server Name and Date to the filename.
EBO 3.2 and earlier
See the Webhelp Topic on collecting these logs from Automation Servers: Viewing and Downloading Automation Server Log Files. This process is now similar to that described above for WorkStation.
-
- Credentials used to log in must be a member of a group that allows the policy of Web Configuration: Allow members to access Automation Server Web Configuration.
- Launch a web browser that is compatible with the installed EBO version as mentioned Webstation Specification Sheet.
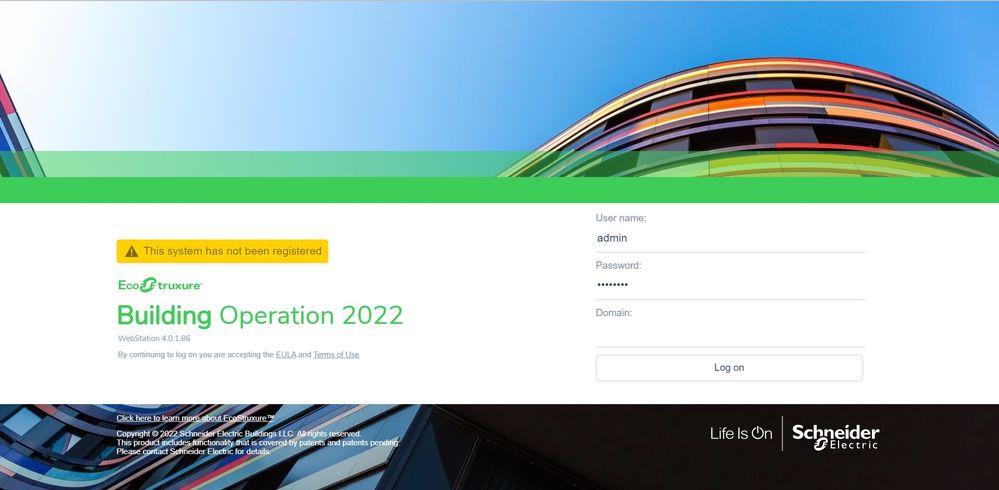
- Type the IP address of the automation server to open the Webstation.
- Log into the Automation Server.
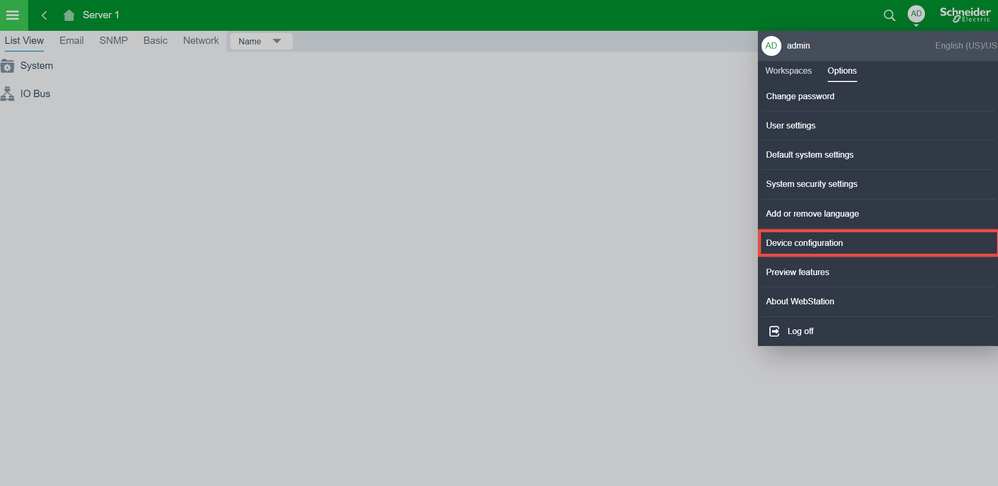
- Once logged into the Automation server, go to the Settings menu in the top right corner and click on Device Configuration.
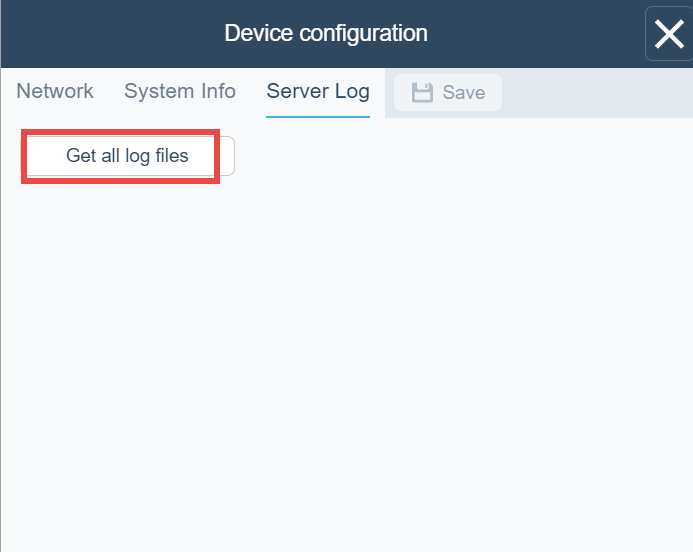
- Click on the Server Log tab to view the automation server's log files. To save a copy of the log to your PC, click on the Get all log files link.
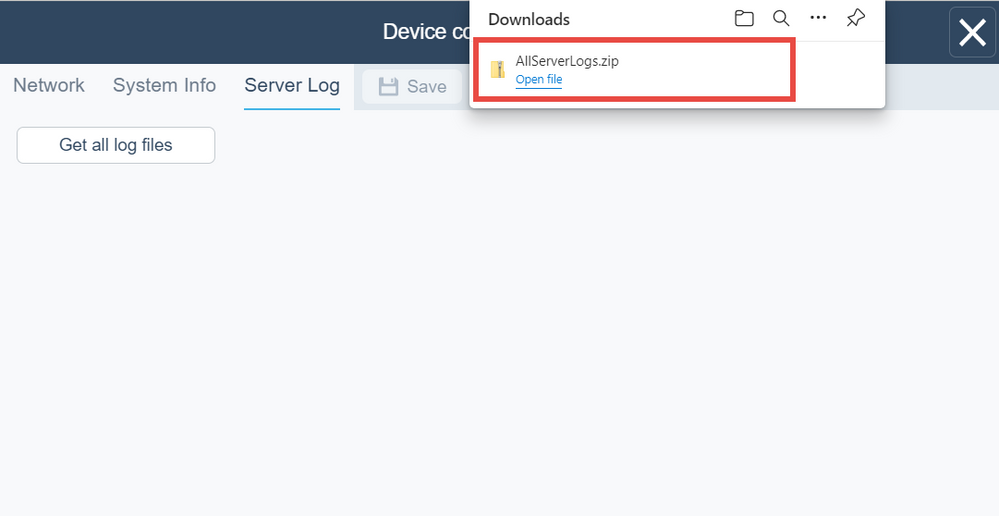
- The log files are compressed into a zip file and exported to downloads folder.
Enterprise Server and Enterprise Central:
For more information, check this article: Error logs from the Enterprise Server and Enterprise Central - Communities
