Share Your Feedback – Help Us Improve Search on Community! Please take a few minutes to participate in our Search Feedback Survey. Your insights will help us deliver the results you need faster and more accurately. Click here to take the survey
Memory Monitoring
Geo SCADA Knowledge Base
Access vast amounts of technical know-how and pro tips from our community of Geo SCADA experts.
Search in
Improve your search experience:
- Exact phrase → Use quotes " " (e.g., "error 404")
- Wildcard → Use * for partial words (e.g., build*, *tion)
- AND / OR → Combine keywords (e.g., login AND error, login OR sign‑in)
- Keep it short → Use 2–3 relevant words , not full sentences
- Filters → Narrow results by section (Knowledge Base, Users, Products)
-
database
32 -
Web Server and Client
31 -
WebX
19 -
Request Form
18 -
Lists, Events & Alarms
16 -
ViewX
15 -
Setup
12 -
Application Programming
12 -
Telemetry
8 -
Events & Alarms
7 -
Lists
7 -
Mimic Graphics
7 -
Downloads
6 -
Geo SCADA Expert
5 -
SCADA
5 -
IoT
5 -
Support
5 -
Drivers and Communications
4 -
Security
4 -
2025
3 -
IEC 61131-3 Logic
3 -
DNP 3
3 -
Virtual ViewX
2 -
Trends and Historian
2 -
Architectures
1 -
Templates and Instances
1 -
Releases
1 -
Maps and GIS
1 -
Mobile
1 -
Geo Scada
1 -
Tools & Resources
1 -
Privacy Policy
1 -
OPC-UA
1 -
ClearSCADA
1 -
Python
1
- Bookmark
- Subscribe
- Email to a Friend
- Printer Friendly Page
- Report Inappropriate Content
Link copied. Please paste this link to share this article on your social media post.
Memory Monitoring
Originally published on Geo SCADA Knowledge Base by Anonymous user | June 10, 2021 04:09 AM
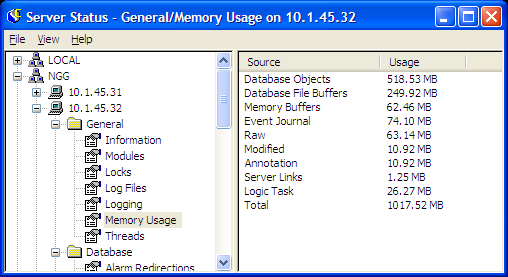
The new 'Memory Usage' page in the General section breaks down the memory usage of the ClearSCADA server. This can be used with the snapshot facility to diagnose memory usage related problems.
A problem that could occur would be too much historic data being logged and the historian not being able to write it all to disk fast enough. This has the effect of keeping all the information in the memory of the server, and in this case you would expect to see the Raw section of memory usage to increase. A similar problem could be seen for the event journal.
This feature does not provide the definitive solution to memory problems. But it does give a general guide into the area of the product to investigate and is a good starting point.
 memmonitoring.pngmemmonitoring.png
Ways to alleviate memory problems
- Add more memory, which seems obvious, but getting to the 32bit limit (4GiB) should be a first start.
- Use the '/3GB' switch in the Boot.ini file, which changes the kernel/userspace memory layout to 3GiB for user programs (like ClearSCADA) and 1GiB for the kernel. The default is a 2GiB/2GiB layout. See Using more than 2GB Memory in Windows or How to Set the /3GB Startup Switch in Windows
- Lower the 'QueryRowLimit' registry key, which controls the maximum number of records that can be returned in a single query, this defaults to 1,000,000 and as such can use a very large amount of memory for a inefficient query.
- Lower the Historic and Event Journal Cache settings. These determine the amount of memory allocated for storing historic and event journal records. While this data is normally stored on disk, the cache is used to search and process the data and it will remain in the cache until that memory is required for new searches etc. This provides better search performance as data does not need to be constantly loaded into and out of memory.
NOTE: Measuring System Memory Usage also discusses how DBServer's memory can be monitored in a system context.
Go: Home Back
Author
Link copied. Please paste this link to share this article on your social media post.
Create your free account or log in to subscribe to the board - and gain access to more than 10,000+ support articles along with insights from experts and peers.

