Measuring System Memory Usage
Geo SCADA Knowledge Base
Access vast amounts of technical know-how and pro tips from our community of Geo SCADA experts.
Search in
Improve your search experience:
- Exact phrase → Use quotes " " (e.g., "error 404")
- Wildcard → Use * for partial words (e.g., build*, *tion)
- AND / OR → Combine keywords (e.g., login AND error, login OR sign‑in)
- Keep it short → Use 2–3 relevant words , not full sentences
- Filters → Narrow results by section (Knowledge Base, Users, Products)
Turn on suggestions
Auto-suggest helps you quickly narrow down your search results by suggesting possible matches as you type.
Invite a Co-worker
Send a co-worker an invite to the portal.Just enter their email address and we'll connect them to register. After joining, they will belong to the same company.
You have entered an invalid email address. Please re-enter the email address.
This co-worker has already been invited to the Exchange portal. Please invite another co-worker.
Please enter email address
Send Invite Cancel
Invitation Sent
Your invitation was sent.Thanks for sharing Exchange with your co-worker.
Send New Invite Close
Top Labels
-
database
32 -
Web Server and Client
31 -
WebX
19 -
Request Form
18 -
Lists, Events & Alarms
16 -
ViewX
15 -
Setup
12 -
Application Programming
12 -
Telemetry
8 -
Events & Alarms
7 -
Lists
7 -
Mimic Graphics
7 -
Downloads
6 -
Geo SCADA Expert
5 -
SCADA
5 -
IoT
5 -
Support
5 -
Drivers and Communications
4 -
Security
4 -
2025
3 -
IEC 61131-3 Logic
3 -
DNP 3
3 -
Virtual ViewX
2 -
Trends and Historian
2 -
Architectures
1 -
Templates and Instances
1 -
Releases
1 -
Maps and GIS
1 -
Mobile
1 -
Geo Scada
1 -
Tools & Resources
1 -
Privacy Policy
1 -
OPC-UA
1 -
ClearSCADA
1 -
Python
1
Anonymous user
Not applicable
2021-06-09
07:15 PM
- Bookmark
- Subscribe
- Email to a Friend
- Printer Friendly Page
- Report Inappropriate Content
Link copied. Please paste this link to share this article on your social media post.
2021-06-09
07:15 PM
Measuring System Memory Usage
Originally published on Geo SCADA Knowledge Base by Anonymous user | June 10, 2021 04:15 AM
📖 Home Back
This article discusses the measurements of memory usage that affect DBserver's performance. When investigating poor performance it is worth checking these measurements to help decide what changes are needed.
All these measurements are available from ClearSCADA's Server Status display, and also from Windows Performance Monitoring counters.
 ServerStatus1.pngServerStatus1.png
As the database or historic caching grows so will the amount of memory that DBserver requires.
This can lead to performance problems or, if taken to extremes, failure of the server. The ClearSCADA Server Status tool (and Snapshots) show the usage of memory. (What DBserver does with all this memory is discussed in Memory Monitoring). The following general measures of memory usage are the important ones.
"Virtual Bytes" = total size of the process, from lowest memory address to the highest allocated; this is its virtual address space. For 32 bit Windows this is limited to 2Gb (the default) or alternatively 3Gb if the /3GB switch has been used and it is supported by the operating system. The "General" tab of the ClearSCADA Status display shows how much headroom DBServer has left as "Available Virtual Memory" (which equals 2Gb - Virtual Bytes, or 3Gb - Virtual Bytes, as appropriate). (Note this is not anything to do with "free virtual memory in the system" - it is specific to DBserver.) This is also available from the Windows Performance Monitor, where the counter is [DraftContent:\Process(DBserver)\Virtual Bytes]. ClearSCADA can access this counter. Sysinternals Process Explorer shows this as "Virtual Size". Windows Task Manager does not show this value (it is NOT the item called "VM Size").
If DBServer's available virtual memory drops to zero it will stop working. However it has been noticed that 32 bit Windows systems become unstable when the DBServer's virtual memory drops below 300 MB.
If you are using 32 bit Windows and already making use of /3GB switch then DBServer will have a virtual address limit of 3Gb and there is no way of giving it more without upgrading to a 64 bit Windows system and 64 bit ClearSCADA. This combination has a 8 Terabyte per user process virtual memory limit on x64 hardware.
The /3GB Boot.ini switch is only effective and supported for certain Windows operating systems (specifically NOT standard Windows 2000 Server). It's use is described by:
A process's virtual address space is divided into pages. At the time a page is used it must be in RAM, but not all pages need to be in RAM all the time. When a page is present in RAM it is in the process' "Working Set". Pages are mapped into the process's Working Set as required - when this happens a "Page Fault" is said to occur (it's not actually a fault though!).
The "General" tab of the ClearSCADA Status display shows the size of DBserver's working set as "DBserver Working Set Size". This is also available from the Windows Performance Monitor, where the counter is [DraftContent:\Process(DBserver)\Working Set] . ClearSCADA can access this counter. Sysinternals Process Explorer shows this as "Working Set". Windows Task Manager Process tab shows this value as "Mem Usage".
DBserver's Working Set is limited to a size that is a lot smaller than its virtual address space, so a page already in the Working Set may have to be unmapped from it to make space for another page to be mapped into it. If it is a writeable page of memory that is being unmapped then the contents are saved to disk in the paging file, so they can be re-loaded into the Working Set for user later on. It can be quite costly writing and reading pages and as DBserver's virtual address space grows it will need to do this more frequently and its "Page Fault" rate will rise, and so its processing speed will become limited by the speed of the disk access.
ClearSCADA can access the Windows Performance Monitor counter [DraftContent:\Memory\Pages Output/sec], high values of which are said to be a good indicator of a RAM shortage. Sysinternals' Process Explorer shows this as "Paging File Write Delta" in the System Information display. Adding more RAM allows working sets to be larger, which reduces the system's page fault rate.
The "General" tab of the ClearSCADA Status display also shows "Available Physical Memory". You might wonder why this "free" memory isn't being used. In fact it consists of free memory plus a cache of pages en-route from processes' working sets to the paging file - this is called the "Standby Memory List". This cache reduces the actual disk i/o caused by paging and is not a waste of memory!
As DBserver grows it will need to reserve space in the paging file for more writeable pages of its virtual address space. The amount of the paging file reserved by DBserver is shown on the "General" tab of the ClearSCADA Status display as "DBServer Paging File Usage". This is also available from the Windows Performance Monitor, the counter is [DraftContent:\Process(DBserver)\Page File Bytes]. ClearSCADA can access this counter. Sysinternals Process Explorer shows this as "Virtual Memory\Private Bytes". Windows Task Manager shows this value as "VM Size".
If DBserver needs more page file space but can't be given any it will stop working. Depending on how Windows is set up the amount of paging file available to the system could be fixed, or adjustable on the fly. The "General" tab of the ClearSCADA Status display shows the headroom left as "Available Paging File" - this is a system resource shared with all other processes . The amount of paging file available is also shown by the Windows Performance Monitor counter [DraftContent:\Memory\ % Committed Bytes in Use] which is the ratio of Committed Bytes to Commit Limit; all these counters are available to ClearSCADA. The Windows task manager and Sysinternals' Process Explorer display this information as "Commit Charge" at the bottom of their main windows.
It is expensive for Windows to increase the size of the paging file on the fly and while it is doing this the system will seem to pause; it also can lead to a fragmented paging file, which is slower to access. It is best to set the initial and maximum size of the paging file to the same value to avoid the "on the fly" growth and fragmentation of the paging file.
See Microsoft Knowledgebase article 197379 about setting up paging files.
You can check the paging files' fragmentation and if necessary de-fragment them using Sysinternals' PageDefrag utility
For quick access to Windows Performance Monitor counters run "perfmon" from the Windows "Run" dialogue. You can quickly create reports with this and also the handy "Explain" button gives descriptions of the counters you have selected (use the "Add Counter" dialogue or navigate to the explanation from the properties of an existing counter).
This gives a lot more information than Windows Task Manager and can be found at Sysinternals - Process Explorer for Windows
 ServerStatus1.pngServerStatus1.png
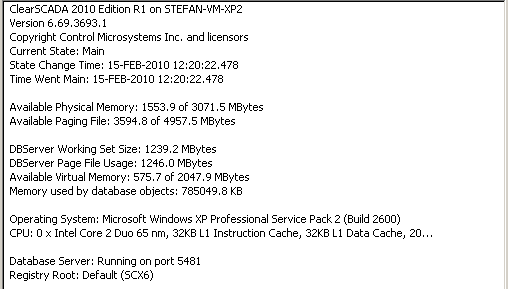
The attached screenshot of the ClearSCADA Server display shows that DBServer has a virtual address space of 1472MB (= 2048MB - 576MB), of which 767MB are database objects (785049.8kB). Other parts of the virtual address space will be private data, private code, shared data and shared code libraries.
DBServer has a working set of 1239 MB. This will include private data, private code, shared data and shared code libraries. Shared pages are potentially shared with other process's working sets.
DBServer has reserved 1554MB of Page File for its private writeable data pages.
The "available paging file" figure is 3595 MB / 4957 MB, which means that the "Commit Charge" as seen at the bottom of the main window of Task Manager shows 2362 MB / 4957 MB, and Process Explorer shows this as 47.6%. The 2362 MB already in use will include the 1246 MB allocated by Dbserver, plus the allocations of other processes. The "Commit Limit" of 4957 Mb is roughly the size of RAM plus the current size of paging file.
As the initial size of the page file is 1246MB the page file was expanded resulting in it being fragmented into 2 parts.
Go: Home Back
This article discusses the measurements of memory usage that affect DBserver's performance. When investigating poor performance it is worth checking these measurements to help decide what changes are needed.
All these measurements are available from ClearSCADA's Server Status display, and also from Windows Performance Monitoring counters.
 ServerStatus1.pngServerStatus1.png
As the database or historic caching grows so will the amount of memory that DBserver requires.
This can lead to performance problems or, if taken to extremes, failure of the server. The ClearSCADA Server Status tool (and Snapshots) show the usage of memory. (What DBserver does with all this memory is discussed in Memory Monitoring). The following general measures of memory usage are the important ones.
Virtual Address Space
"Virtual Bytes" = total size of the process, from lowest memory address to the highest allocated; this is its virtual address space. For 32 bit Windows this is limited to 2Gb (the default) or alternatively 3Gb if the /3GB switch has been used and it is supported by the operating system. The "General" tab of the ClearSCADA Status display shows how much headroom DBServer has left as "Available Virtual Memory" (which equals 2Gb - Virtual Bytes, or 3Gb - Virtual Bytes, as appropriate). (Note this is not anything to do with "free virtual memory in the system" - it is specific to DBserver.) This is also available from the Windows Performance Monitor, where the counter is [DraftContent:\Process(DBserver)\Virtual Bytes]. ClearSCADA can access this counter. Sysinternals Process Explorer shows this as "Virtual Size". Windows Task Manager does not show this value (it is NOT the item called "VM Size").
If DBServer's available virtual memory drops to zero it will stop working. However it has been noticed that 32 bit Windows systems become unstable when the DBServer's virtual memory drops below 300 MB.
If you are using 32 bit Windows and already making use of /3GB switch then DBServer will have a virtual address limit of 3Gb and there is no way of giving it more without upgrading to a 64 bit Windows system and 64 bit ClearSCADA. This combination has a 8 Terabyte per user process virtual memory limit on x64 hardware.
The /3GB Boot.ini switch is only effective and supported for certain Windows operating systems (specifically NOT standard Windows 2000 Server). It's use is described by:
Working Set
A process's virtual address space is divided into pages. At the time a page is used it must be in RAM, but not all pages need to be in RAM all the time. When a page is present in RAM it is in the process' "Working Set". Pages are mapped into the process's Working Set as required - when this happens a "Page Fault" is said to occur (it's not actually a fault though!).
The "General" tab of the ClearSCADA Status display shows the size of DBserver's working set as "DBserver Working Set Size". This is also available from the Windows Performance Monitor, where the counter is [DraftContent:\Process(DBserver)\Working Set] . ClearSCADA can access this counter. Sysinternals Process Explorer shows this as "Working Set". Windows Task Manager Process tab shows this value as "Mem Usage".
DBserver's Working Set is limited to a size that is a lot smaller than its virtual address space, so a page already in the Working Set may have to be unmapped from it to make space for another page to be mapped into it. If it is a writeable page of memory that is being unmapped then the contents are saved to disk in the paging file, so they can be re-loaded into the Working Set for user later on. It can be quite costly writing and reading pages and as DBserver's virtual address space grows it will need to do this more frequently and its "Page Fault" rate will rise, and so its processing speed will become limited by the speed of the disk access.
ClearSCADA can access the Windows Performance Monitor counter [DraftContent:\Memory\Pages Output/sec], high values of which are said to be a good indicator of a RAM shortage. Sysinternals' Process Explorer shows this as "Paging File Write Delta" in the System Information display. Adding more RAM allows working sets to be larger, which reduces the system's page fault rate.
The "General" tab of the ClearSCADA Status display also shows "Available Physical Memory". You might wonder why this "free" memory isn't being used. In fact it consists of free memory plus a cache of pages en-route from processes' working sets to the paging file - this is called the "Standby Memory List". This cache reduces the actual disk i/o caused by paging and is not a waste of memory!
Paging File Use
As DBserver grows it will need to reserve space in the paging file for more writeable pages of its virtual address space. The amount of the paging file reserved by DBserver is shown on the "General" tab of the ClearSCADA Status display as "DBServer Paging File Usage". This is also available from the Windows Performance Monitor, the counter is [DraftContent:\Process(DBserver)\Page File Bytes]. ClearSCADA can access this counter. Sysinternals Process Explorer shows this as "Virtual Memory\Private Bytes". Windows Task Manager shows this value as "VM Size".
If DBserver needs more page file space but can't be given any it will stop working. Depending on how Windows is set up the amount of paging file available to the system could be fixed, or adjustable on the fly. The "General" tab of the ClearSCADA Status display shows the headroom left as "Available Paging File" - this is a system resource shared with all other processes . The amount of paging file available is also shown by the Windows Performance Monitor counter [DraftContent:\Memory\ % Committed Bytes in Use] which is the ratio of Committed Bytes to Commit Limit; all these counters are available to ClearSCADA. The Windows task manager and Sysinternals' Process Explorer display this information as "Commit Charge" at the bottom of their main windows.
It is expensive for Windows to increase the size of the paging file on the fly and while it is doing this the system will seem to pause; it also can lead to a fragmented paging file, which is slower to access. It is best to set the initial and maximum size of the paging file to the same value to avoid the "on the fly" growth and fragmentation of the paging file.
See Microsoft Knowledgebase article 197379 about setting up paging files.
You can check the paging files' fragmentation and if necessary de-fragment them using Sysinternals' PageDefrag utility
Windows Performance Monitor
For quick access to Windows Performance Monitor counters run "perfmon" from the Windows "Run" dialogue. You can quickly create reports with this and also the handy "Explain" button gives descriptions of the counters you have selected (use the "Add Counter" dialogue or navigate to the explanation from the properties of an existing counter).
Sysinternals Process Explorer
This gives a lot more information than Windows Task Manager and can be found at Sysinternals - Process Explorer for Windows
Example
 ServerStatus1.pngServerStatus1.png
The attached screenshot of the ClearSCADA Server display shows that DBServer has a virtual address space of 1472MB (= 2048MB - 576MB), of which 767MB are database objects (785049.8kB). Other parts of the virtual address space will be private data, private code, shared data and shared code libraries.
DBServer has a working set of 1239 MB. This will include private data, private code, shared data and shared code libraries. Shared pages are potentially shared with other process's working sets.
DBServer has reserved 1554MB of Page File for its private writeable data pages.
The "available paging file" figure is 3595 MB / 4957 MB, which means that the "Commit Charge" as seen at the bottom of the main window of Task Manager shows 2362 MB / 4957 MB, and Process Explorer shows this as 47.6%. The 2362 MB already in use will include the 1246 MB allocated by Dbserver, plus the allocations of other processes. The "Commit Limit" of 4957 Mb is roughly the size of RAM plus the current size of paging file.
As the initial size of the page file is 1246MB the page file was expanded resulting in it being fragmented into 2 parts.
Go: Home Back
Author
Link copied. Please paste this link to share this article on your social media post.
To The Top!
Subscribing is a smart move!
You can subscribe to this board after you log in or create your free account.
Create your free account or log in to subscribe to the board - and gain access to more than 10,000+ support articles along with insights from experts and peers.
Terms & Conditions
Privacy Notice
Change your Cookie Settings
© 2025 Schneider Electric

