Group's planned average mark
EcoStruxure IT forum
Schneider Electric support forum about installation and configuration for DCIM including EcoStruxure IT Expert, IT Advisor, Data Center Expert, and NetBotz
- Subscribe to RSS Feed
- Mark Topic as New
- Mark Topic as Read
- Float this Topic for Current User
- Bookmark
- Subscribe
- Mute
- Printer Friendly Page
- Mark as New
- Bookmark
- Subscribe
- Mute
- Subscribe to RSS Feed
- Permalink
- Email to a Friend
- Report Inappropriate Content
Link copied. Please paste this link to share this article on your social media post.
Posted: 2020-07-02 11:27 AM . Last Modified: 2024-04-10 12:33 AM
Group's planned average mark
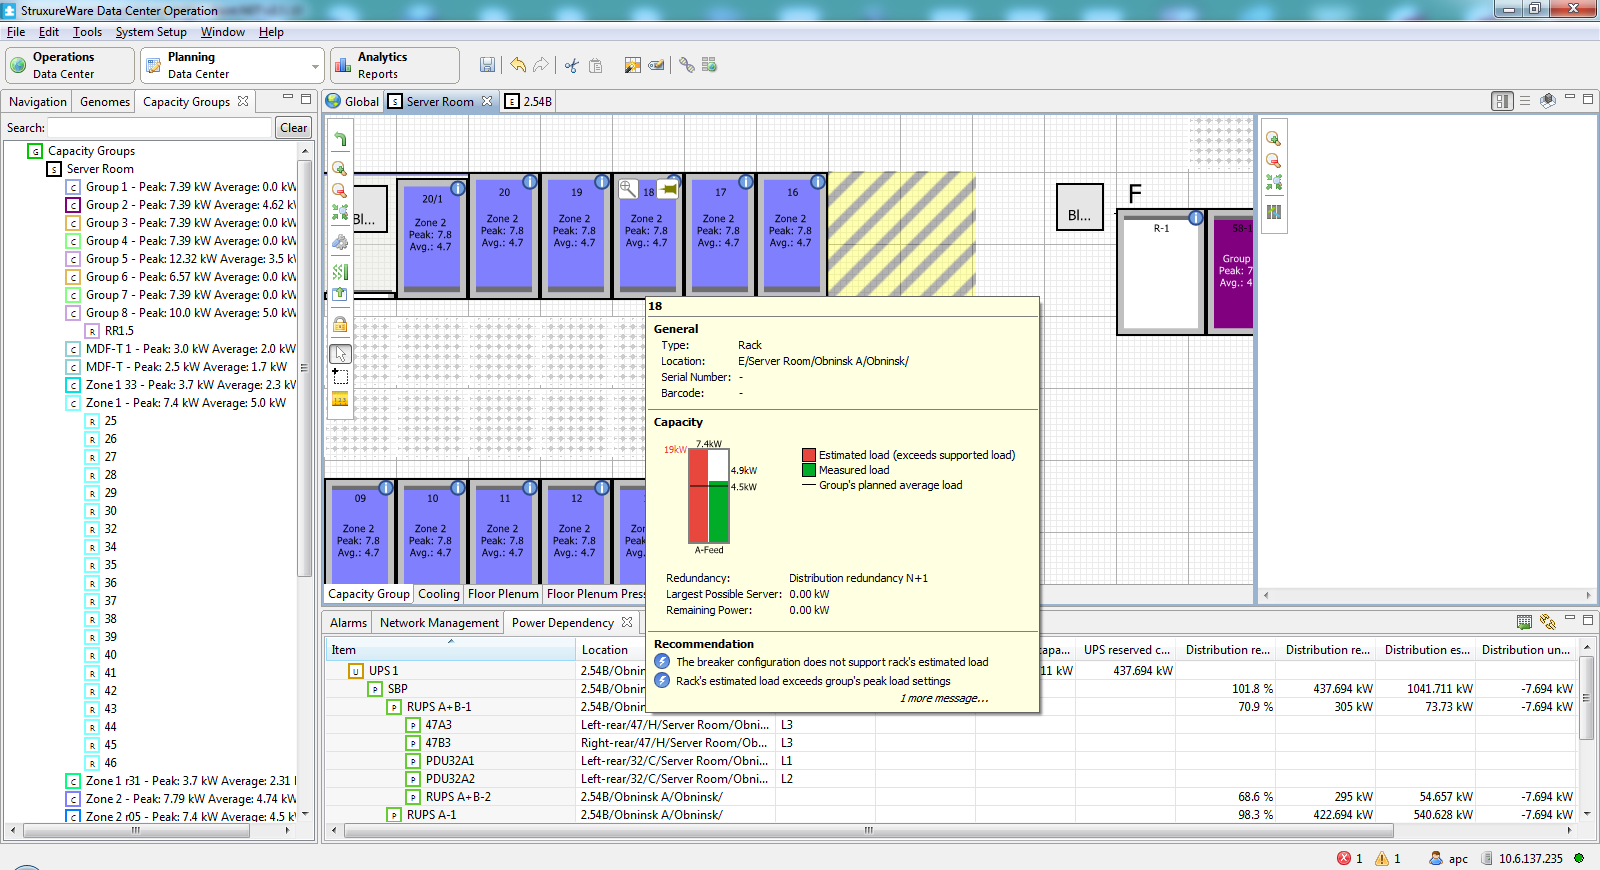
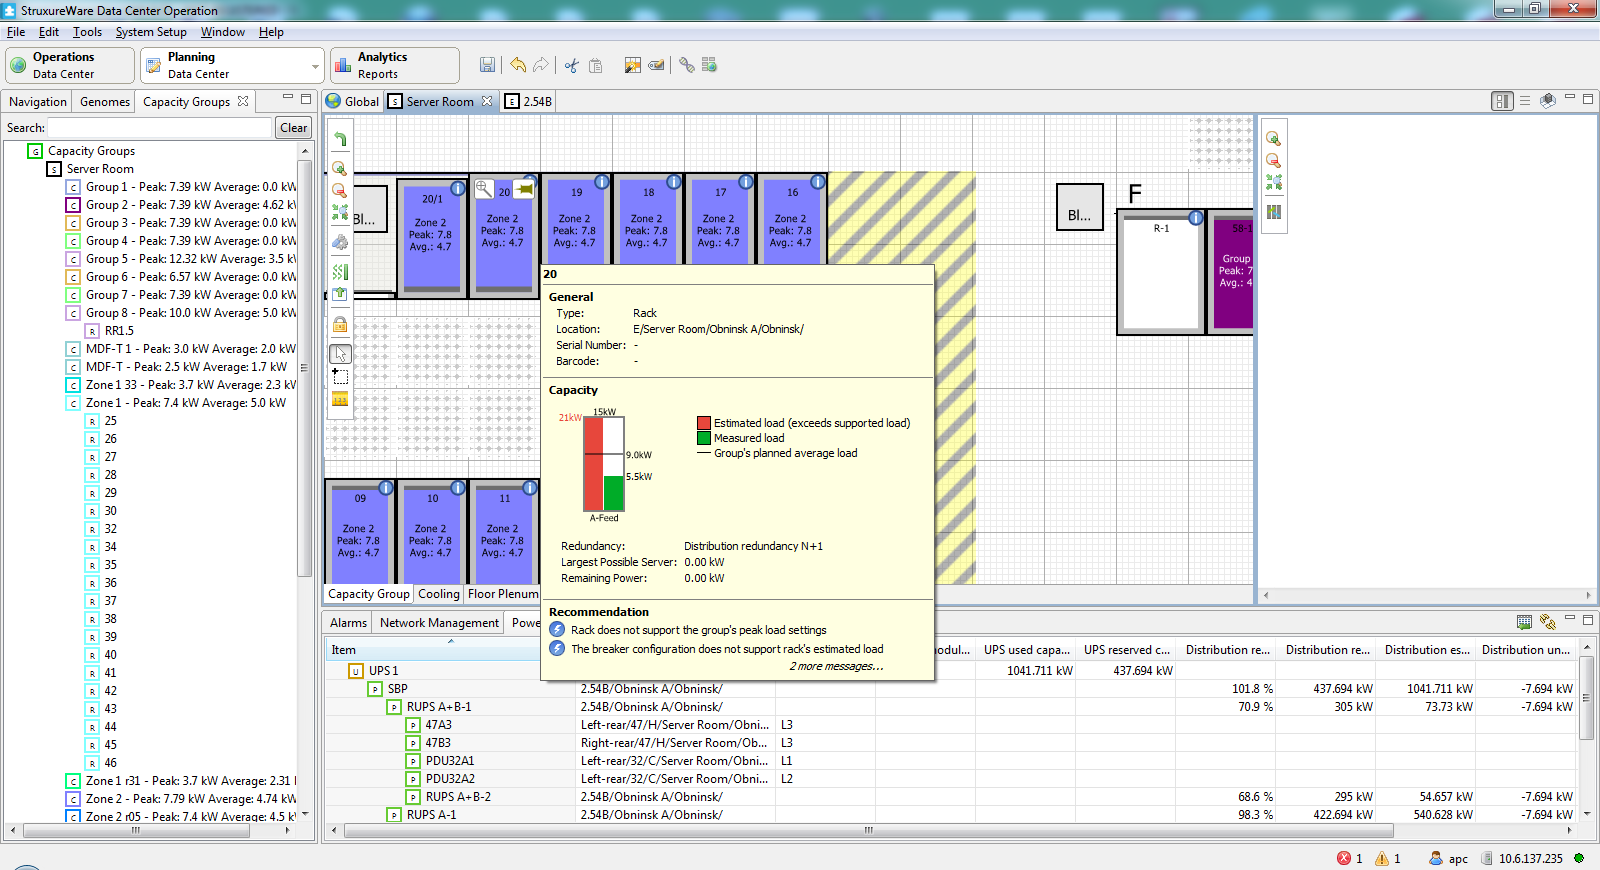
Why Group's planned average mark value displayed on Tool tip is different from rack to rack in one capacity group and from configured average?
Example:
Group's average is 4.7 kW, for most of racks its displayed as 4.5 kw and at one rack it show 9 kW


In other Capacity Groups a have several values within group.
Could anyone explain this?
(CID:95354900)
- Labels:
-
Data Center Operation
- Tags:
- capacity
Link copied. Please paste this link to share this article on your social media post.
- Mark as New
- Bookmark
- Subscribe
- Mute
- Subscribe to RSS Feed
- Permalink
- Email to a Friend
- Report Inappropriate Content
Link copied. Please paste this link to share this article on your social media post.
Posted: 2020-07-02 11:27 AM . Last Modified: 2024-04-10 12:33 AM
Hi Valentin, Could you please post a screenshot of properties of the capacity groups you are having issues with? Please make sure that the advanced section is expanded in the screenshots. Regards, Torben
(CID:95354911)
Link copied. Please paste this link to share this article on your social media post.
- Mark as New
- Bookmark
- Subscribe
- Mute
- Subscribe to RSS Feed
- Permalink
- Email to a Friend
- Report Inappropriate Content
Link copied. Please paste this link to share this article on your social media post.
Posted: 2020-07-02 11:27 AM . Last Modified: 2024-04-10 12:33 AM
Valentin Kozlov ?
(CID:95355128)
Link copied. Please paste this link to share this article on your social media post.
- Mark as New
- Bookmark
- Subscribe
- Mute
- Subscribe to RSS Feed
- Permalink
- Email to a Friend
- Report Inappropriate Content
Link copied. Please paste this link to share this article on your social media post.
Posted: 2020-07-02 11:28 AM . Last Modified: 2024-04-10 12:33 AM
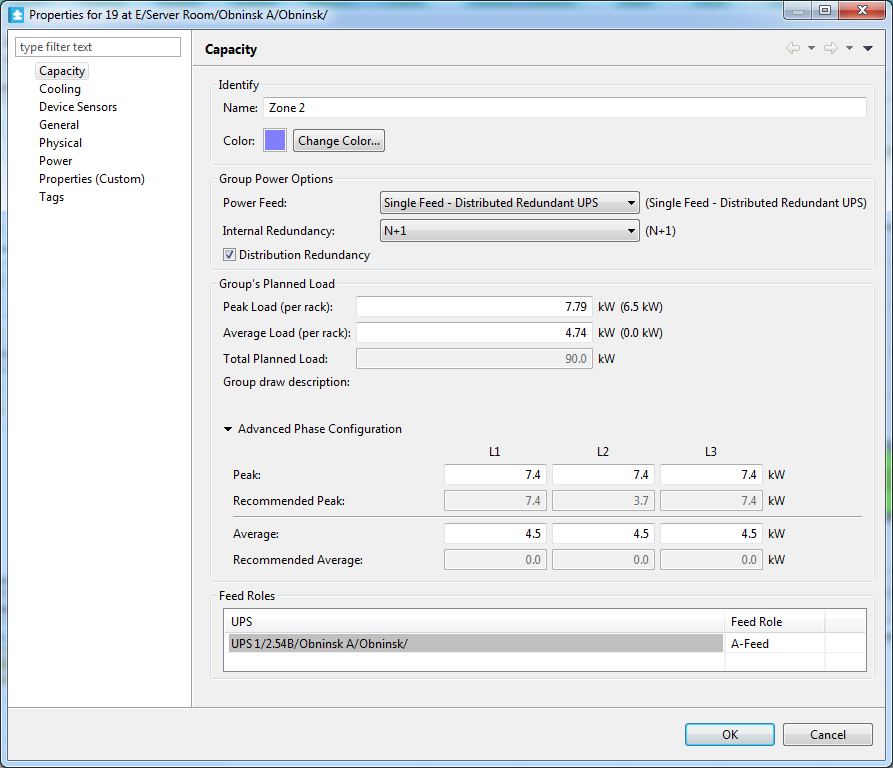
Here is Capacity Group properties:

(CID:95355154)
Link copied. Please paste this link to share this article on your social media post.
- Mark as New
- Bookmark
- Subscribe
- Mute
- Subscribe to RSS Feed
- Permalink
- Email to a Friend
- Report Inappropriate Content
Link copied. Please paste this link to share this article on your social media post.
Posted: 2020-07-02 11:28 AM . Last Modified: 2024-04-10 12:33 AM
Hi Valentin, Thanks for posting the update. We'll look into this. Regards, Torben
(CID:95355156)
Link copied. Please paste this link to share this article on your social media post.
- Mark as New
- Bookmark
- Subscribe
- Mute
- Subscribe to RSS Feed
- Permalink
- Email to a Friend
- Report Inappropriate Content
Link copied. Please paste this link to share this article on your social media post.
Posted: 2020-07-02 11:28 AM . Last Modified: 2024-04-10 12:33 AM
Hi Valentin,
As seen from the advanced phase configuration the average per phase is 4.5kW. This is the value shown in the UI tooltip.
The racks with 9kW is having 2 phases which each will provide 4.5kW.
The groups average load and the phase load is depended on each other and will when chanced influence one another. Reason for the 4.74 in group average planned is most likely that you have a number of racks in the group and some of these have more than 1 phase giving that the over all capacity available in the group in average is higher than the individual phase.
More information regarding capacity groups can be found Capacity Group Properties
(CID:95355396)
Link copied. Please paste this link to share this article on your social media post.
- Mark as New
- Bookmark
- Subscribe
- Mute
- Subscribe to RSS Feed
- Permalink
- Email to a Friend
- Report Inappropriate Content
Link copied. Please paste this link to share this article on your social media post.
Posted: 2020-07-02 11:28 AM . Last Modified: 2023-10-31 11:00 PM

This question is closed for comments. You're welcome to start a new topic if you have further comments on this issue.
Link copied. Please paste this link to share this article on your social media post.
Create your free account or log in to subscribe to the board - and gain access to more than 10,000+ support articles along with insights from experts and peers.
