Ask our Experts
Didn't find what you are looking for? Ask our experts!
Schneider Electric support forum about installation and configuration for DCIM including EcoStruxure IT Expert, IT Advisor, Data Center Expert, and NetBotz
Search in
Link copied. Please paste this link to share this article on your social media post.
Posted: 2020-07-03 12:25 AM . Last Modified: 2024-04-09 12:55 AM
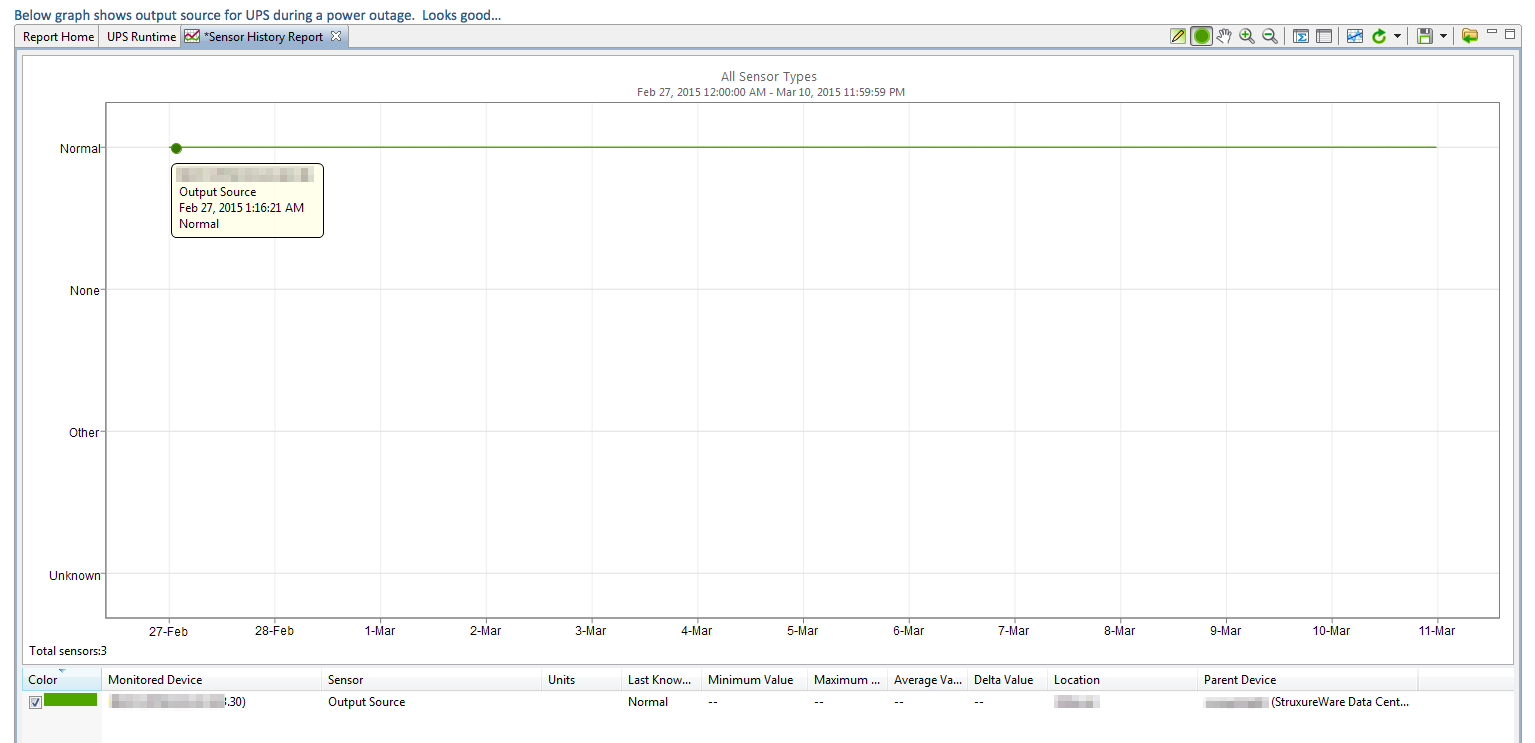
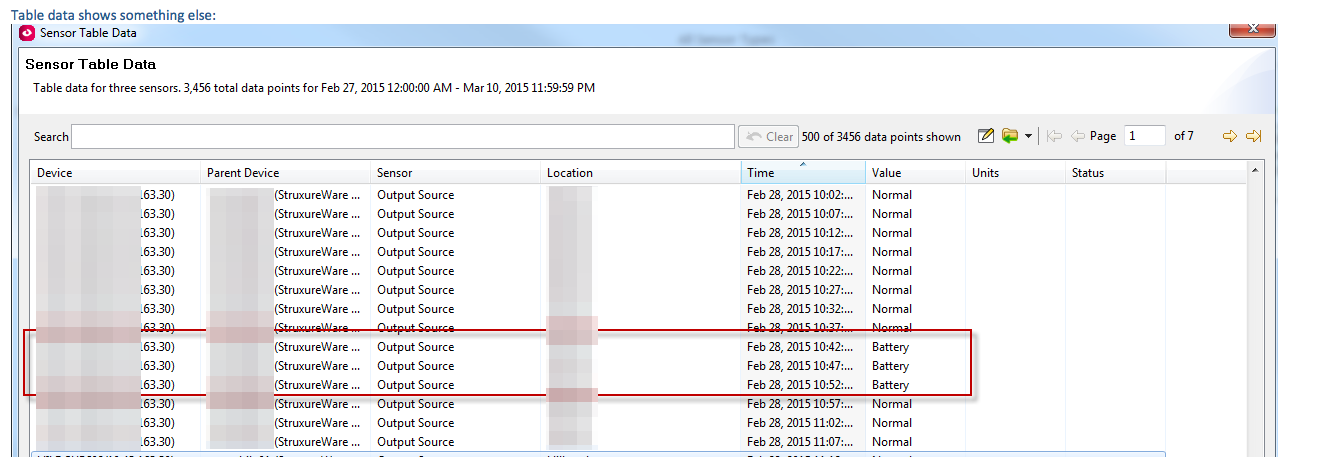
A customer has some cases where the graphical report in Data Center Expert are not showing the same values as in the table view:


That makes it difficult to trust the graphical reports.
Is this a known issue or is there a workaround?
--Christian
(CID:105467001)
Link copied. Please paste this link to share this article on your social media post.
Link copied. Please paste this link to share this article on your social media post.
Posted: 2020-07-03 12:25 AM . Last Modified: 2024-04-09 12:55 AM
Hi Christian,
My first thought on this would be to check out k-base FA158422. It states that ISXC / DCE "graphs may not include all data points including some peaks or valleys". This will in part be based on how many data points are being graphed. I would suggest verifying this is what's happening by graphing that specific day instead of the 2 weeks that are graphed on that image. Please also keep in mind that if this is a critical value, DCE can always alert based on that state change.
Thanks,
Steve
(CID:105467038)
Link copied. Please paste this link to share this article on your social media post.
Link copied. Please paste this link to share this article on your social media post.
Posted: 2020-07-03 12:26 AM . Last Modified: 2023-10-31 10:26 PM

This question is closed for comments. You're welcome to start a new topic if you have further comments on this issue.
Link copied. Please paste this link to share this article on your social media post.
You’ve reached the end of your document
Create your free account or log in to subscribe to the board - and gain access to more than 10,000+ support articles along with insights from experts and peers.