Share Your Feedback – Help Us Improve Search on Community! Please take a few minutes to participate in our Search Feedback Survey. Your insights will help us deliver the results you need faster and more accurately. Click here to take the survey
Diagnosing DBServer Thread CPU Usage
Geo SCADA Knowledge Base
Access vast amounts of technical know-how and pro tips from our community of Geo SCADA experts.
Search in
Improve your search experience:
- Exact phrase → Use quotes " " (e.g., "error 404")
- Wildcard → Use * for partial words (e.g., build*, *tion)
- AND / OR → Combine keywords (e.g., login AND error, login OR sign‑in)
- Keep it short → Use 2–3 relevant words , not full sentences
- Filters → Narrow results by section (Knowledge Base, Users, Products)
-
database
32 -
Web Server and Client
31 -
WebX
19 -
Request Form
18 -
Lists, Events & Alarms
16 -
ViewX
15 -
Setup
12 -
Application Programming
12 -
Telemetry
8 -
Events & Alarms
7 -
Lists
7 -
Mimic Graphics
7 -
Downloads
6 -
Geo SCADA Expert
5 -
SCADA
5 -
IoT
5 -
Support
5 -
Drivers and Communications
4 -
Security
4 -
2025
3 -
IEC 61131-3 Logic
3 -
DNP 3
3 -
Virtual ViewX
2 -
Trends and Historian
2 -
Architectures
1 -
Templates and Instances
1 -
Releases
1 -
Maps and GIS
1 -
Mobile
1 -
Geo Scada
1 -
Tools & Resources
1 -
Privacy Policy
1 -
OPC-UA
1 -
ClearSCADA
1 -
Python
1
- Bookmark
- Subscribe
- Email to a Friend
- Printer Friendly Page
- Report Inappropriate Content
Link copied. Please paste this link to share this article on your social media post.
Diagnosing DBServer Thread CPU Usage
Originally published on Geo SCADA Knowledge Base by Anonymous user | June 09, 2021 11:58 PM
DBServer handles tasks such as logic, main-standby synchronizing and ViewX communication, all of which could put a heavy load on the system. Knowing which thread is using large amounts of CPU time will provide an indication of what parts of the system are performing badly or may be configured incorrectly.
The problem with the ClearSCADA Server's Display of threads is that it shows thread CPU time accumulated since DBServer started, so immediate or intermittent peaks might not be visible. To locate the culprits Windows Performance monitor (perfmon.exe) can be used.
To determine which parts of DBServer are using the CPU, open up performance monitor (under Administrative Tools). (If the performance monitor of your operating system doesn't support the export of data to a CSV file you can use perfmon4.exe from the Windows Resource Kit, however this isn't vital.)
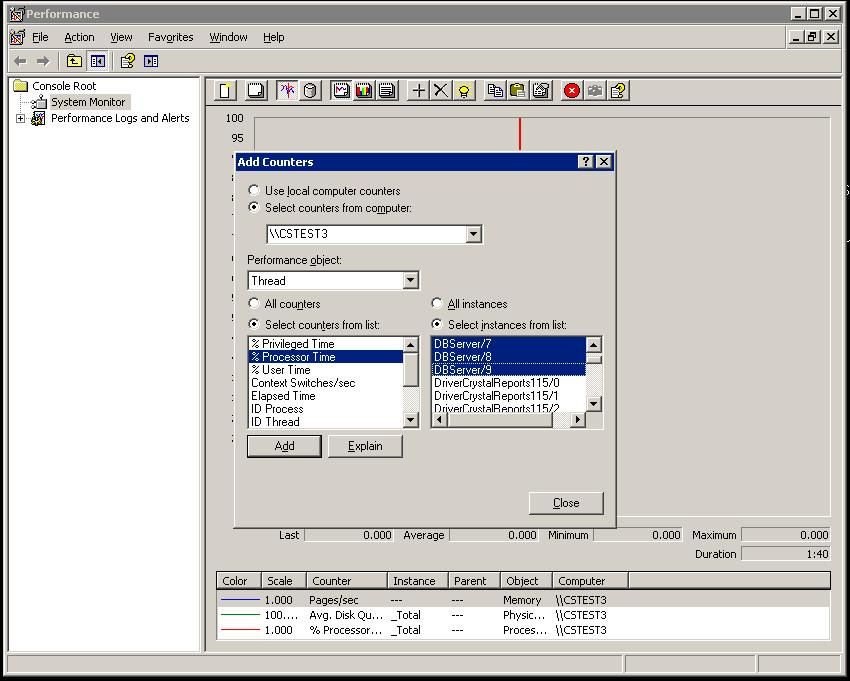
Add a new trace to the graph using the plus sign, select the correct machine and in the Performance Object box choose 'Thread'. In the Counters box choose '% Processor Time' and in the instance box choose all the DBServer options (approximately 30 of them, you can use the shift key to highlight in bulk).Click Add, then Close.
 DBServer1.jpgDBServer1.jpg
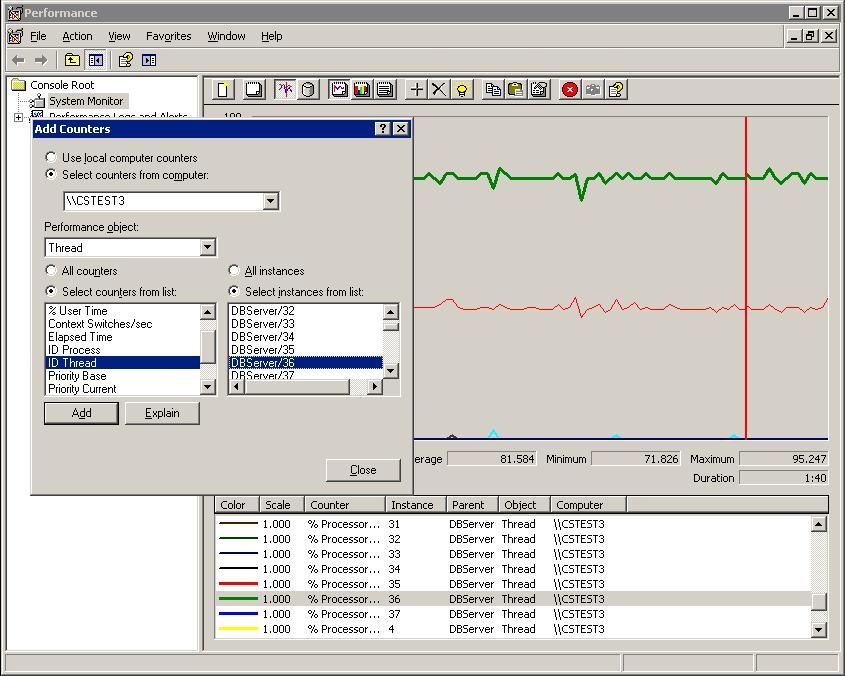
In the graph check to see which of the instances has highest usage. Using the key, find out that thread's instance number.
For example,in the image below DBServer threads being monitored, thread 36 has the maximum CPU Usage.
Now go back to the Add Trace window by clicking on the plus sign and select 'Thread' as the Performance object. Select 'ID Thread' in the counters window and in the instance window, select the instance that was showing the highest usage (the number after the / ).(For example,in the image below it is DBServer/36)
Click Add and Close again.
 DBServer2.jpgDBServer2.jpg
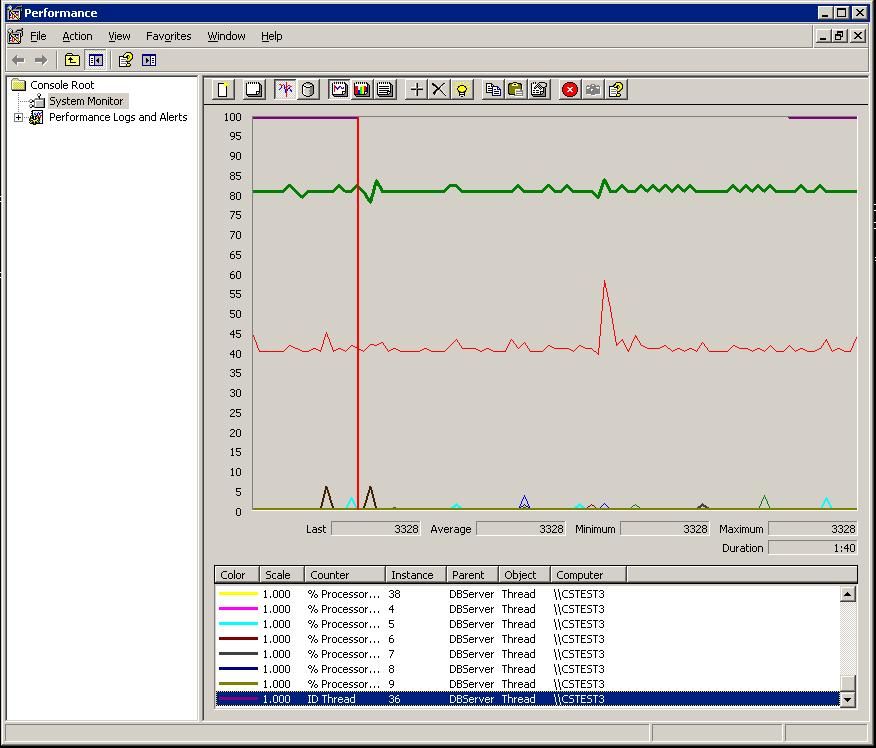
Using the graph's key at the bottom, scroll down to the newly added trace, it will show the Thread's ID, which is a constant number and so in the Minimum, Maximum and Average boxes the value will be identical. Take a note of this number.
In the image below, this number is 3328.
 DBServer4.jpgDBServer4.jpg
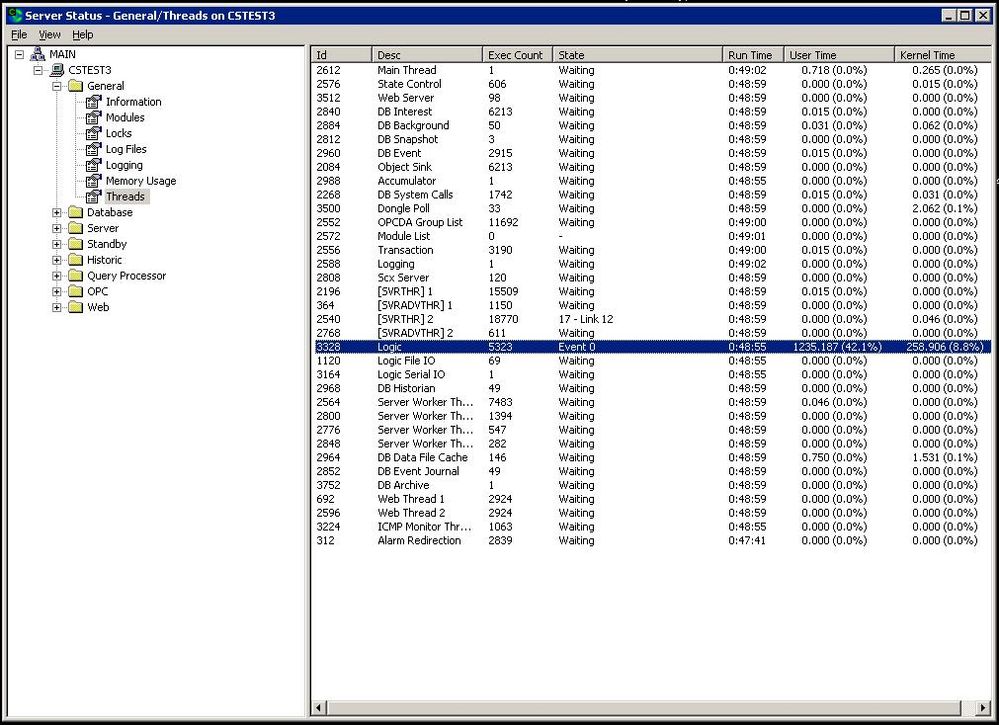
Open up the ClearSCADA Status Dialogue on the machine and go to the Threads tab. Match up the ID Thread from above with the Id in the table that is displayed.
 DBServer5.jpgDBServer5.jpg
So after getting the ID, we can find from the Status Dialogue which part of DBServer is consuming the maximum CPU.
Instance 0 is the main control thread and so doesn't appear in the list
On a multiprocessor system the actual contribution DBServer threads make to the CPU usage shown by Task Manager is the total of the threads' figures divided by the number of processors.
What If Performance Monitors Weren't Set Up?
You will have to use the ClearSCADA Server Status display or DB Snapshots (ClearSCADA 2007 R0 and later). Go to section 7 (General Threads) and look for the threads' CPU consumption, then go to a later snapshot and compare the threads' CPU consumption. Look for threads that have used up large amounts of time. For example:
Id |Desc |Exec Count|State |Run Time |User Time |Kernel Time h3. +h4. +h4. +h4. +h1. h4. +h4. ==+h4. h2. 28/07/07 10:00 -> 5948|Logic |43308210 |Event 1 |286:26:38| 87281.156 (8.5%)| 575.921 (0.1%) 30/07/07 07:00 -> 5948|Logic |51173199 |Event 1 |331:26:37|107418.531 (9.0%)| 715.093 (0.1%)
Between snapshots the thread ran for an elapsed time of 162000s (=331h 26m 37s - 286h 26m 38s) during which it used 20137.375s (=107418.531 - 87281.156) of CPU time in user mode and 139.172s (=715.093 - 575.921) of CPU time in privileged mode. Between the snapshots this equates to 12.4% (=20137/162000) in user mode and 0.09% (=139/162000) in privileged mode. (Note that the % figures logged inside brackets in the snapshot cover the whole period since the thread started, not just the time window you are interested in.)
If you add up the % figures for all of DBServer's threads you will get the total % CPU used by DBServer, which is also shown by the performance monitor "\Process(DBServer)\% Processor Time".
For example this might add up to 60%. On a multiprocessor system the actual contribution DBServer makes to the CPU usage shown by Task Manager is this total divided by the number of processors, so in this example it would be 15% of the CPU resources of a four processor system. Of this 3.1% (=12.4 / 4) would be the Logic thread.
Go: Home Back
Author
Link copied. Please paste this link to share this article on your social media post.
Create your free account or log in to subscribe to the board - and gain access to more than 10,000+ support articles along with insights from experts and peers.

