
Ask our Experts
Didn't find what you are looking for? Ask our experts!
Schneider Electric support forum about installation and configuration for DCIM including EcoStruxure IT Expert, IT Advisor, Data Center Expert, and NetBotz
Search in
Link copied. Please paste this link to share this article on your social media post.
Posted: 2020-07-04 01:46 AM . Last Modified: 2024-04-05 04:01 AM
Hi,
We have installed two sensor pods per containment and i want to plot a single graph showing the average of the two sensor..png)
how do i achive this on struxtureware DCE
(CID:126174689)
Link copied. Please paste this link to share this article on your social media post.
Link copied. Please paste this link to share this article on your social media post.
Posted: 2020-07-04 01:47 AM . Last Modified: 2024-04-05 04:01 AM
Dear ADEKUNLE AGBOKE,
You need to create a virtual sensor of average value above the specified two physical sensors. This is what you need.
With respect.
(CID:126174696)
Link copied. Please paste this link to share this article on your social media post.
Link copied. Please paste this link to share this article on your social media post.
Posted: 2020-07-04 01:47 AM . Last Modified: 2024-04-05 04:01 AM
Thanks for the feed back can you please guide or show me how to create a virtual sensor
(CID:126174710)
Link copied. Please paste this link to share this article on your social media post.
Link copied. Please paste this link to share this article on your social media post.
Posted: 2020-07-04 01:47 AM . Last Modified: 2024-04-05 04:01 AM
There are several ways to do this. The most intuitive one is to select two sensor pods together and call the corresponding context menu as in the screenshot:
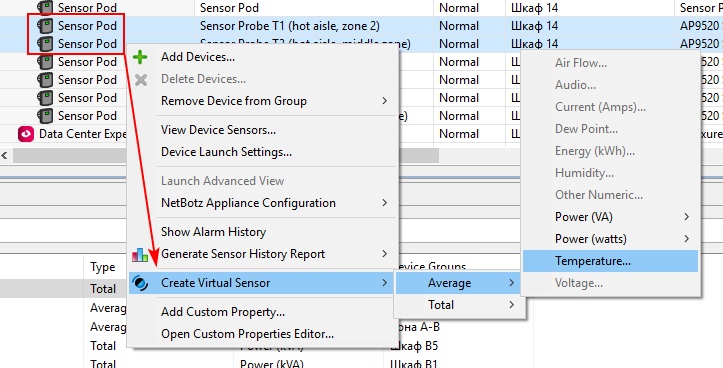
With respect.
(CID:126174715)
Link copied. Please paste this link to share this article on your social media post.
Link copied. Please paste this link to share this article on your social media post.
Posted: 2020-07-04 01:47 AM . Last Modified: 2023-10-22 03:53 AM

This question is closed for comments. You're welcome to start a new topic if you have further comments on this issue.
Link copied. Please paste this link to share this article on your social media post.
You’ve reached the end of your document
Create your free account or log in to subscribe to the board - and gain access to more than 10,000+ support articles along with insights from experts and peers.
