Ask our Experts
Didn't find what you are looking for? Ask our experts!
Launch of Consumer/Home Owner registration process! We are pleased to announce the commencement of the Consumer/Home Owner Registration Process on Community. Consumers/Home Owners may now proceed to register by clicking on Login/Register. The process is straightforward and designed to be completed in just a few steps.
Schneider Electric support forum about installation and configuration for DCIM including EcoStruxure IT Expert, IT Advisor, Data Center Expert, and NetBotz
Search in
Link copied. Please paste this link to share this article on your social media post.
Posted: 2020-07-04 02:45 PM . Last Modified: 2024-04-05 02:32 AM
(CID:129402683)
Link copied. Please paste this link to share this article on your social media post.
Link copied. Please paste this link to share this article on your social media post.
Posted: 2020-07-04 02:45 PM . Last Modified: 2024-04-05 02:32 AM
Hi Ibrahim,
In the installed Client, sclientorry but no, line graphs are all that is available in DCE. The only exception is when using the "Device Inventory" reports.
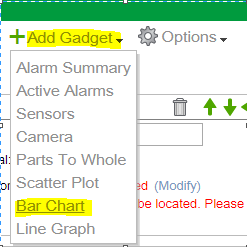
On the web interface, there is an option to select a bar chart gadget:

Other than this, the customer would want to export their data and import it into a spreadsheet/graphing application such as Microsoft Excel where they can get the exact kind of graph they want.
Thanks,
Steve
(CID:129402833)
Link copied. Please paste this link to share this article on your social media post.
Link copied. Please paste this link to share this article on your social media post.
Posted: 2020-07-04 02:45 PM . Last Modified: 2023-10-22 02:50 AM

This question is closed for comments. You're welcome to start a new topic if you have further comments on this issue.
Link copied. Please paste this link to share this article on your social media post.
You’ve reached the end of your document
Create your free account or log in to subscribe to the board - and gain access to more than 10,000+ support articles along with insights from experts and peers.