Ask our Experts
Didn't find what you are looking for? Ask our experts!
Share Your Feedback – Help Us Improve Search on Community! Please take a few minutes to participate in our Search Feedback Survey. Your insights will help us deliver the results you need faster and more accurately. Click here to take the survey
Schneider Electric support forum about installation and configuration for DCIM including EcoStruxure IT Expert, IT Advisor, Data Center Expert, and NetBotz
Search in
Link copied. Please paste this link to share this article on your social media post.
Posted: 2020-07-05 04:00 PM . Last Modified: 2024-04-03 11:14 PM
Hi,
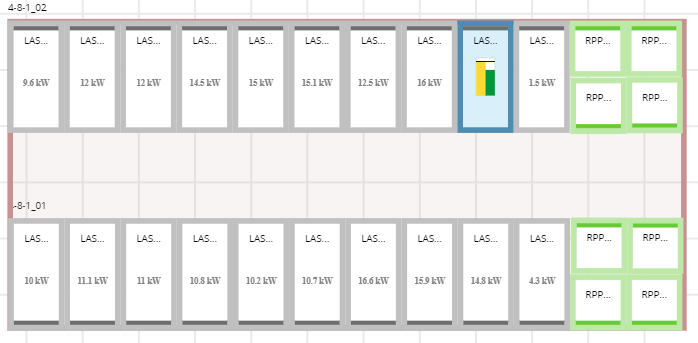
I am running the latest DCO and found that not all cabinets are showing bar graphs on web interface power layer. Here is screenshot:

Only one rack shows bar graph (yellow:estimated, green: theoretical peak) and all the rest just numeric value (theoretical peak).
I tested with Chrome, Firefox, IE and Edge as well but the result is the same.
How can I see bar graphs on each rack?
(CID:137731791)
Link copied. Please paste this link to share this article on your social media post.
Link copied. Please paste this link to share this article on your social media post.
Posted: 2020-07-05 04:00 PM . Last Modified: 2024-04-03 11:13 PM
Hello Mate
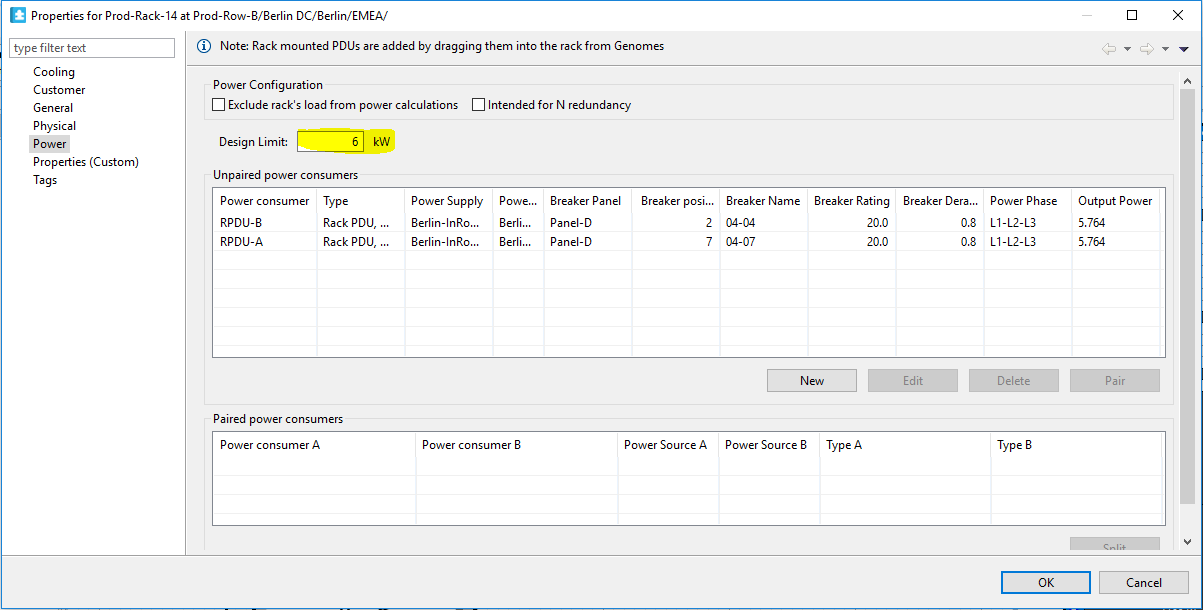
Try setting a design limit on the racks in the room. This will cause the power overlay to appear in the web client.
To set the design limit, from the dco desktop client go to the power properties view of the rack and place a value in the design limit field like in the example I pasted below.

Design limit values can also be assigned using the multi-edit feature of the equipment browser.

Regards
Greg Sterling
(CID:137732501)
Link copied. Please paste this link to share this article on your social media post.
Link copied. Please paste this link to share this article on your social media post.
Posted: 2020-07-05 04:00 PM . Last Modified: 2023-10-22 01:39 AM

This question is closed for comments. You're welcome to start a new topic if you have further comments on this issue.
Link copied. Please paste this link to share this article on your social media post.
You’ve reached the end of your document
Create your free account or log in to subscribe to the board - and gain access to more than 10,000+ support articles along with insights from experts and peers.