
Ask our Experts
Didn't find what you are looking for? Ask our experts!
Share Your Feedback – Help Us Improve Search on Community! Please take a few minutes to participate in our Search Feedback Survey. Your insights will help us deliver the results you need faster and more accurately. Click here to take the survey
Schneider Electric support forum about installation and configuration for DCIM including EcoStruxure IT Expert, IT Advisor, Data Center Expert, and NetBotz
Search in
Link copied. Please paste this link to share this article on your social media post.
Posted: 2020-07-04 05:57 PM . Last Modified: 2024-04-04 11:44 PM
Hi all!
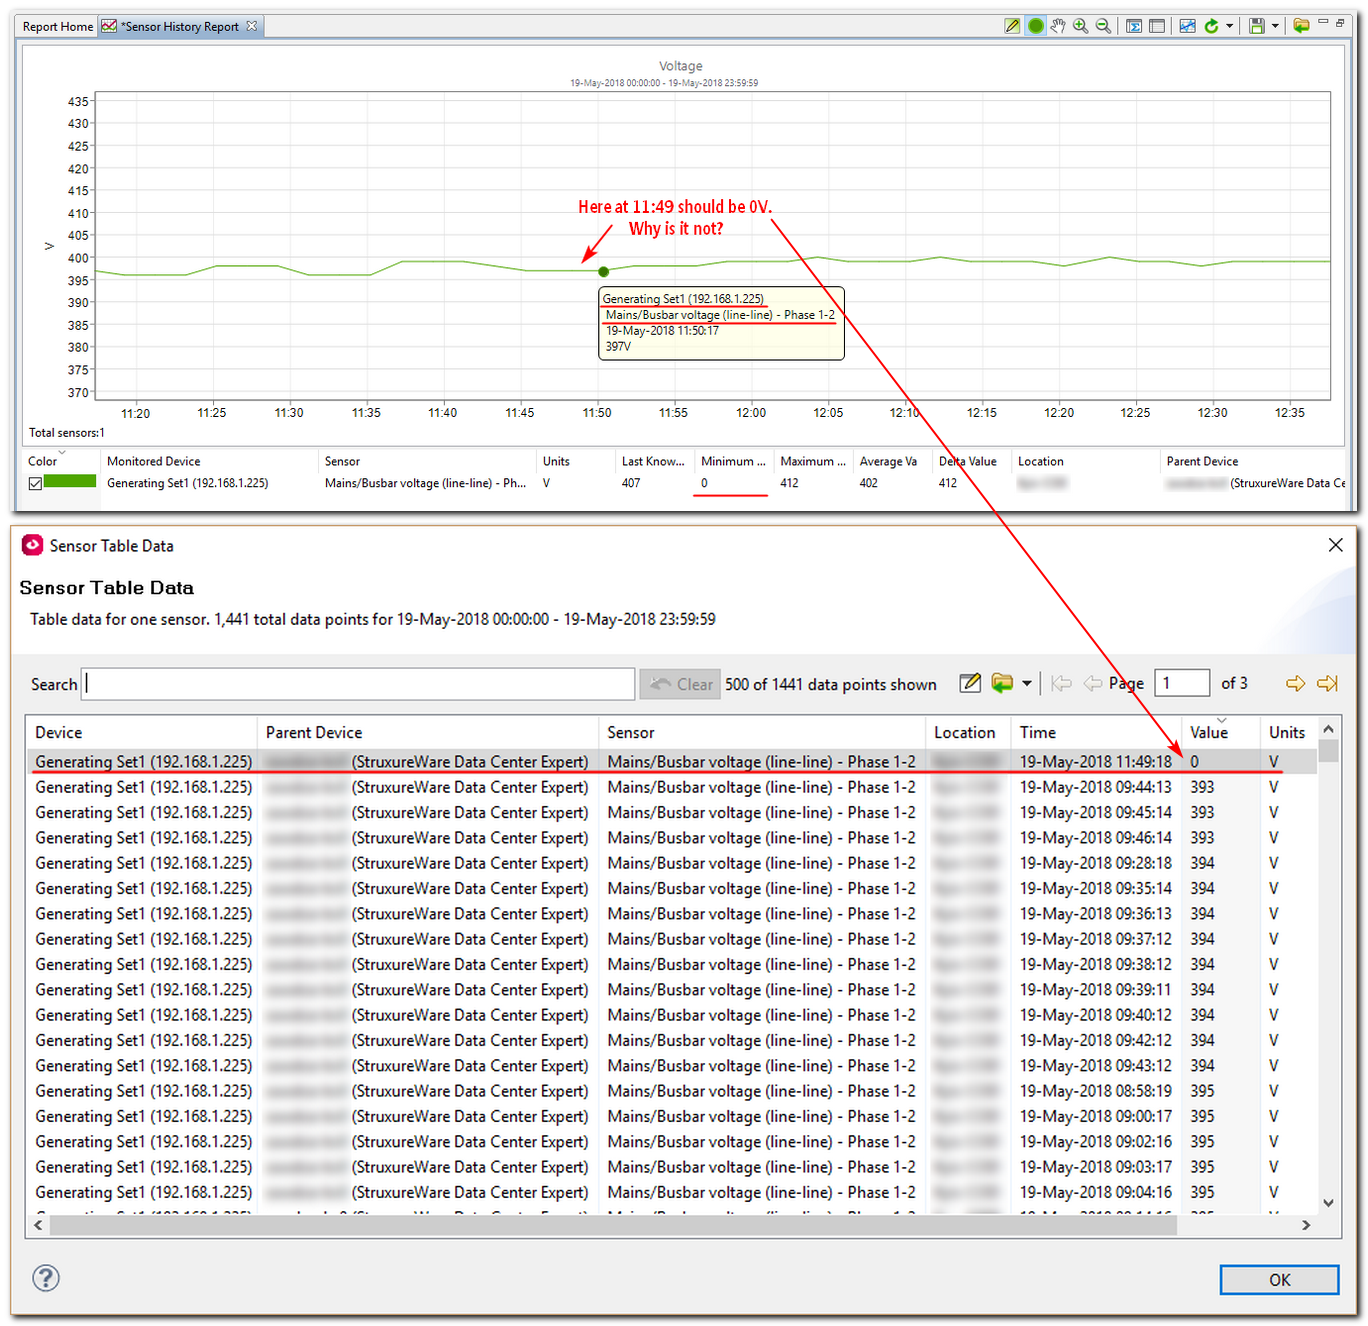
I found this bug when creating a graph Sensor History Report in the DCE-7.5.0 client: for some reason, for example, the graph of the voltage sensor (integer value without decimal point) does not show a single zero value. But in Sensor Table Data this single zero value is present:
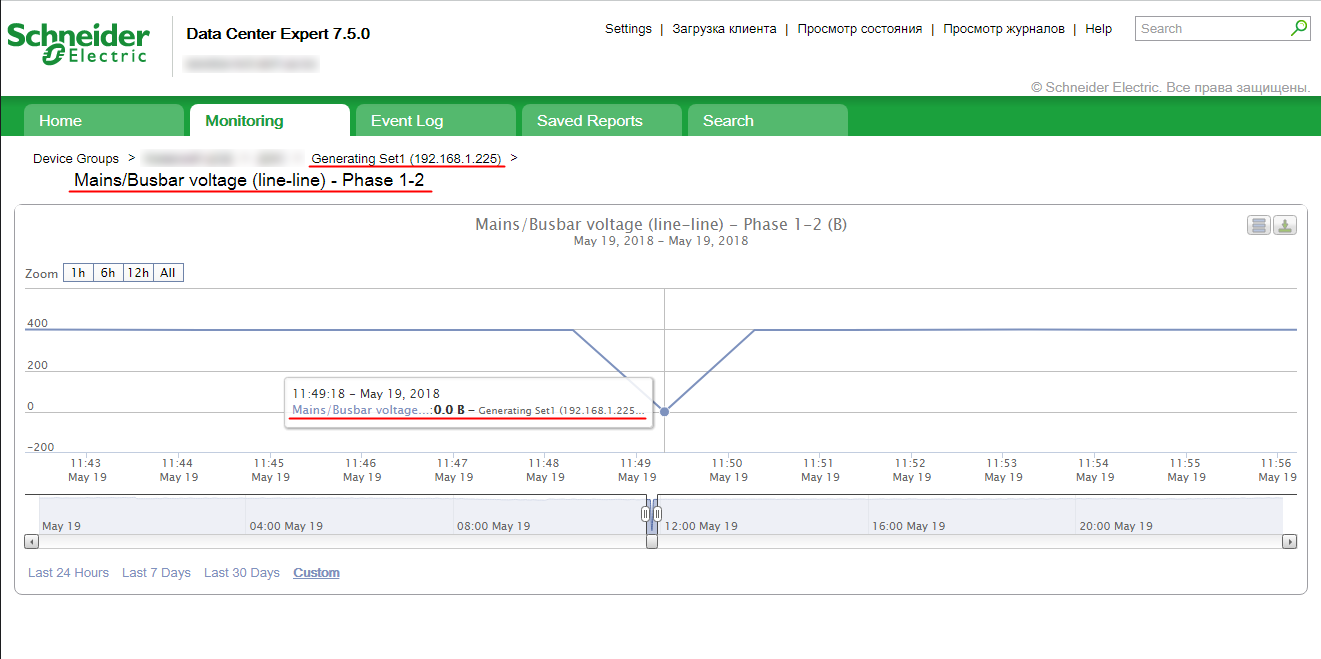
In addition, the same single zero value voltage is successfully show on the graph sensor history report in DCE-7.5.0 web-GUI:
The above screenshots are made from the same DCE-server. And the above single zero voltage value was real and this was the reason for starting the genset in operation. That's why it's important and that's why I noticed this bug.
Very thanks for the support.
(CID:131963773)
Link copied. Please paste this link to share this article on your social media post.
Link copied. Please paste this link to share this article on your social media post.
Posted: 2020-07-04 05:57 PM . Last Modified: 2024-04-04 11:44 PM
Hi!
It is definitely not 7.5 related behavior. Same issue you can see approximately from version 7.3.
Graph is always approximated with some certain number of points. You can easily check this if create report for a long period (i.e. for a year) with known gaps or big differences. This gaps will be approximated.
In other words - it's not a bug, it's a feature 😀
I'm not sure why DCE client designed in this manner, probably for PC resource usage optimization.
(CID:131964049)
Link copied. Please paste this link to share this article on your social media post.
Link copied. Please paste this link to share this article on your social media post.
Posted: 2020-07-04 05:57 PM . Last Modified: 2024-04-04 11:44 PM
This is the number one reason to always look at raw data
Graphing numeric sensor data containing over 10,000 data points, or state sensor data: An algorithm reduces the data points to reach the maximum number of points to graph while retaining the overall shape of the data. The number of sensors, the time range of the report, and the total number of data points returned from the server is considered. Minimum or maximum data points for isolated spikes or drops may be eliminated.
http://www.apc.com/sg/en/faqs/index?page=content&id=FA158422
(CID:131964112)
Link copied. Please paste this link to share this article on your social media post.
Link copied. Please paste this link to share this article on your social media post.
Posted: 2020-07-04 05:57 PM . Last Modified: 2024-04-04 11:44 PM
Dear Christopherus Laurentius and Valentin Kozlov,
On the optimization of drawing graph data at different time periods in DCE software, I already knew. This can be seen particularly well in the DCE web-GUI. It's good and normally working.
But what I reported above is really a bug DCE-client that requires fixes, because: in my screenshots above, you can be sure, that the graph is drawn for a period of one day (May 19) and contains only 1441 measurement points. Then according to FA158422 such a graph should draw absolutely all measurement points without any optimizations:
Resolution:
Graphing numeric sensor data containing 10,000 data points and under: An algorithm retains significant outliers in the data set, for example, a spike or a drop in temperature or voltage.
To confirm all of the above, below is my screenshot from the same DCE server for the same event on the same time period with the same number of measurement points (1441), but in frequency. The only difference is the accuracy of the frequency measurement, i.e. with decimal point (0.0Hz):
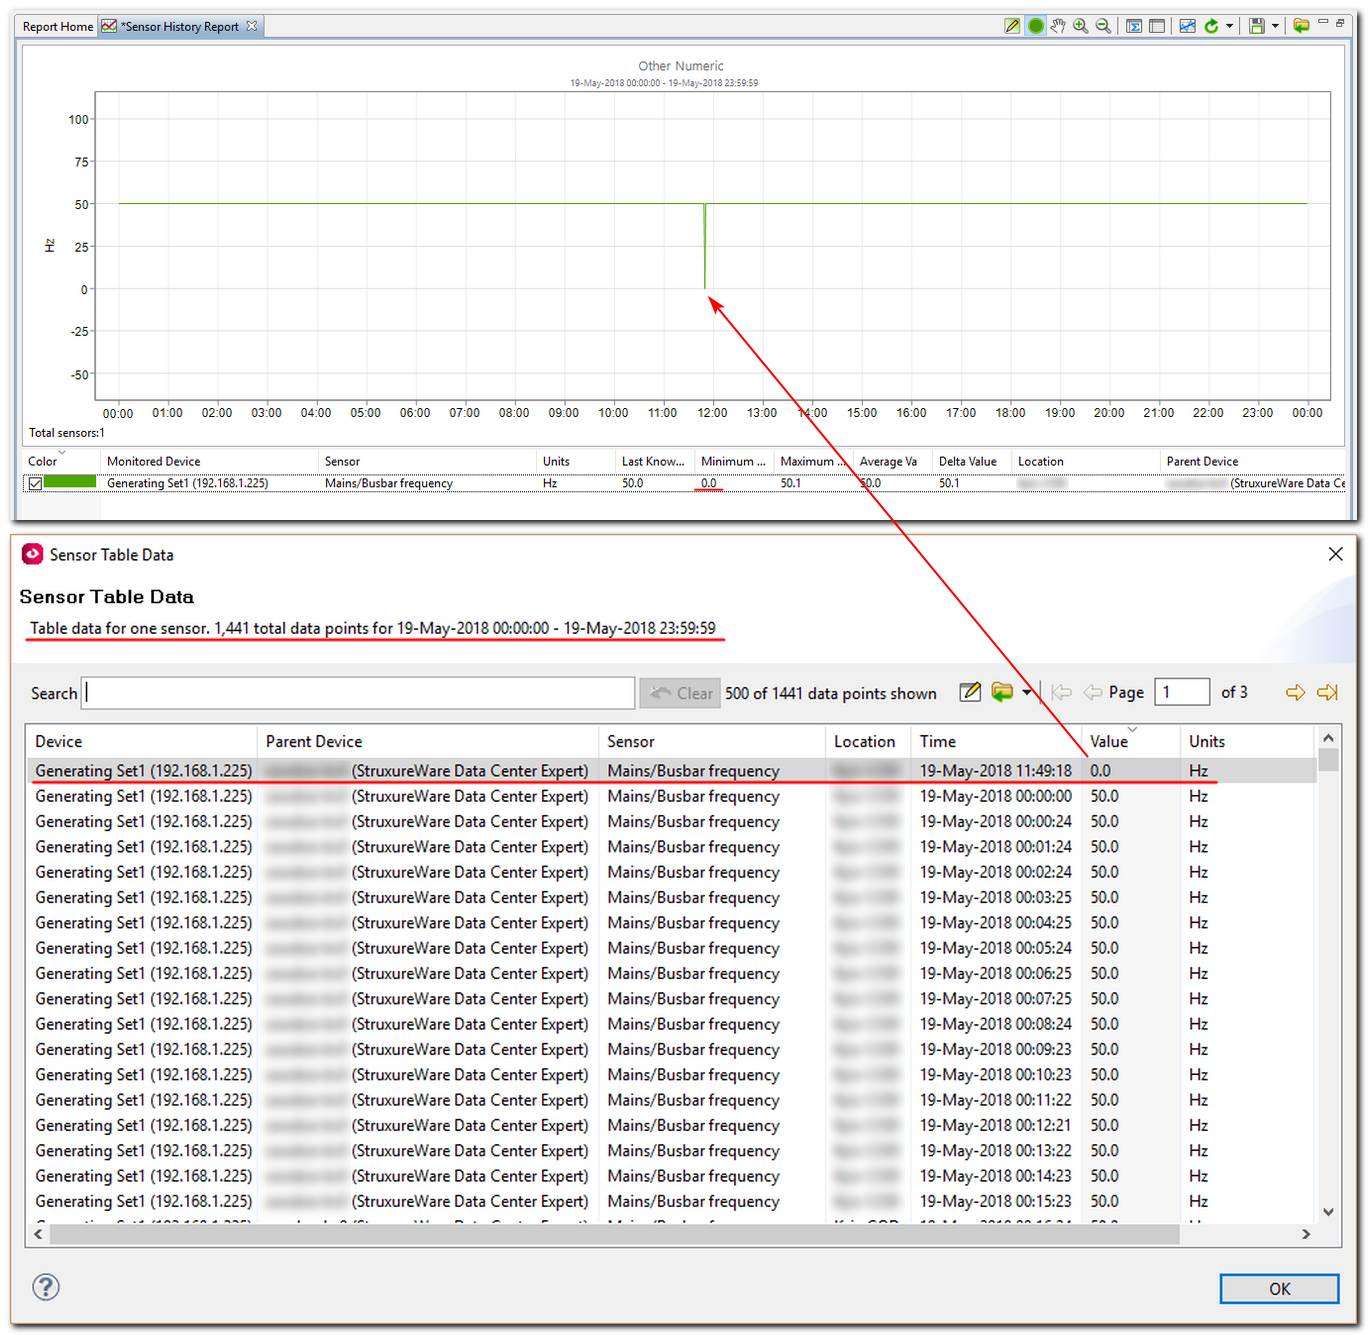
From this screenshot it is clearly seen, that a single zero value is present on the graph Sensor History Report and in the Sensor Table Data. This is really correct 😀.
Colleagues, what do you say to this?
Very thanks for the support.
(CID:131964275)
Link copied. Please paste this link to share this article on your social media post.
Link copied. Please paste this link to share this article on your social media post.
Posted: 2020-07-04 05:57 PM . Last Modified: 2024-04-04 11:44 PM
Dear Christopherus Laurentius and Valentin Kozlov,
Addition to my question: for voltage sensors, the above problem does not depend on the accuracy of the measurement (it does not matter whether the accuracy is 0V or 0.0V or 0.00V).
Dear Schneider Electric colleagues, can I and the other members of the EcoStruxure IT community know whether this bug will be fixed in the nearest new release of DCE-7.x software? For us it is really critical.
Waiting for your reply.
Very thanks for the support.
(CID:131966477)
Link copied. Please paste this link to share this article on your social media post.
Link copied. Please paste this link to share this article on your social media post.
Posted: 2020-07-04 05:57 PM . Last Modified: 2023-10-22 01:11 AM

This question is closed for comments. You're welcome to start a new topic if you have further comments on this issue.
Link copied. Please paste this link to share this article on your social media post.
You’ve reached the end of your document
Create your free account or log in to subscribe to the board - and gain access to more than 10,000+ support articles along with insights from experts and peers.
