Issue
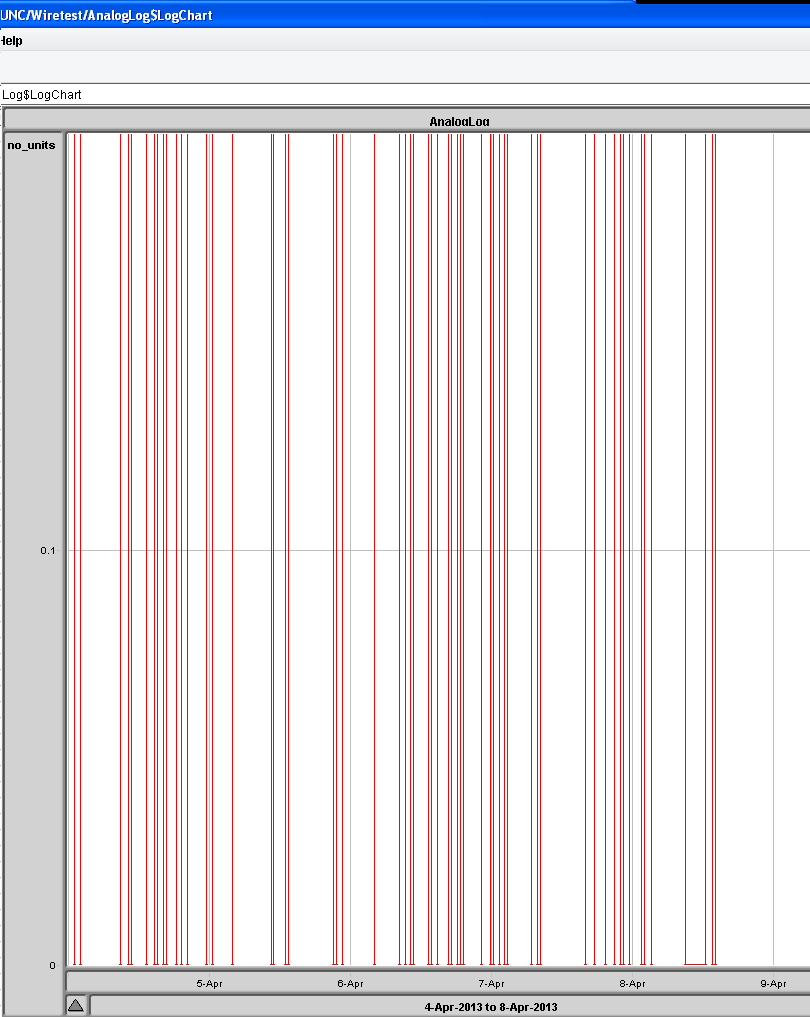
The vertical scale (y-axis) in an R2 chart/log is limited to the range of 0 - 0.2, but the values in the log/ table are of a much wider range; e.g. 0.66 - 87.33.
Environment
R2 chart/ log data
Cause
Initial testing shows that the y-axis scaling issue is caused by data value of NA in the log table.
Resolution
As a work around, backup the station, export the .xml file. Search it for data = NaN. Edit the line in the file so the data no longer shows NaN.


