Issue
What diagnostic information is available within Niagara that can be sent to Product Support or acted on locally?
Product Line
TAC IA Series
Environment
- I/A Series Enterprise Server
- I/A Series Jace
Cause
Jace or Enterprise Server operating slow or specific problems are causing the need for debugging a station or platform
Resolution
There are several diagnostic tools available:
- Check the station Resource Manager
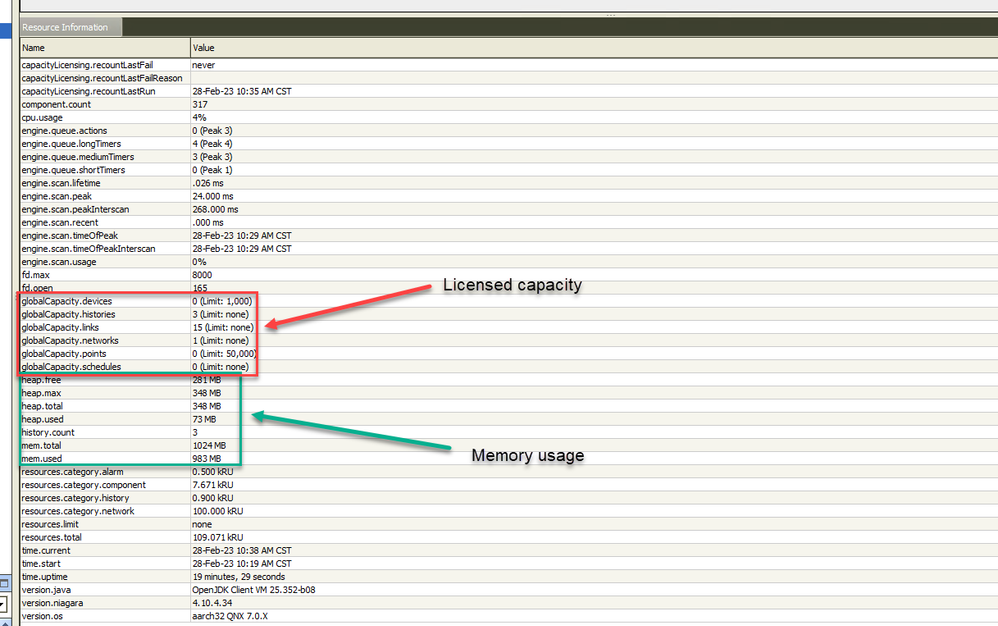
Right-click on the station and select "Views - Station Summary"
This will open up a resource monitor page where you can check CPU and memory usage. The CPU should not be consistently above 80%. Spiking is common as the process is executing and completing tasks. There are other things easily referenced here also.
Heap memory will vary as well. It can slowly increase until a garbage collection cycle releases unused heap back to the pool. You should never use more than 75% of the total available heap memory. Heap Memory is primarily used by station modules and java program objects, so if the memory usage is high, these 2 might be the main reasons
- Engine Hogs
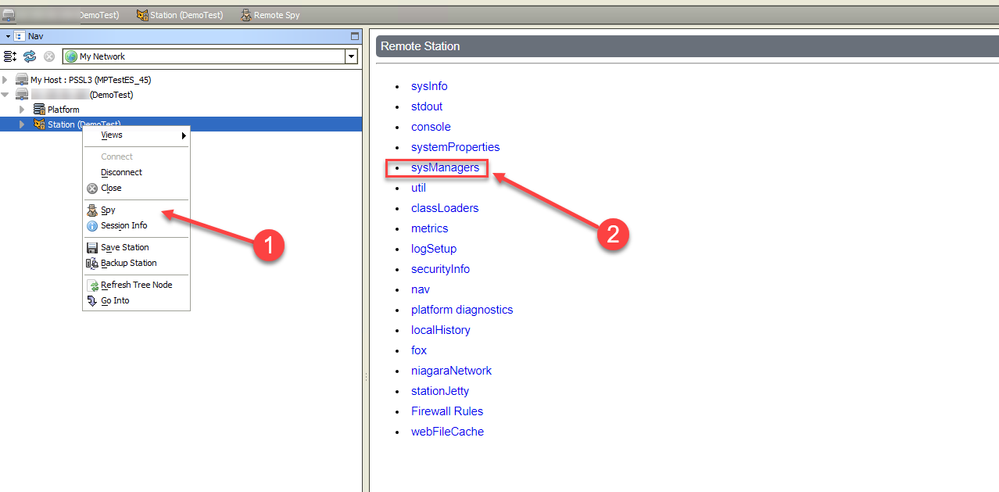
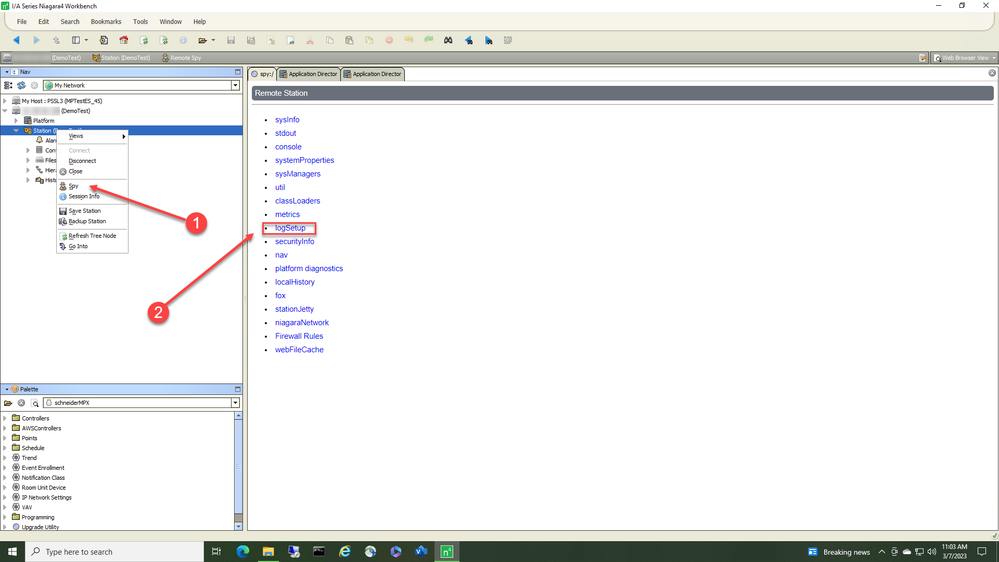
- Right-click on the station, and select "Spy".
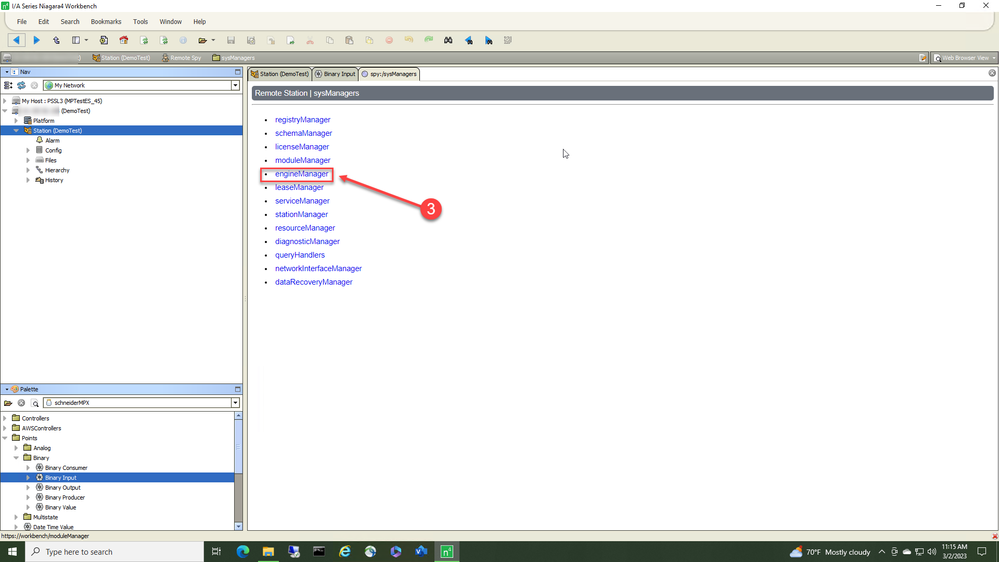
- From the main view, click on "sysManagers".
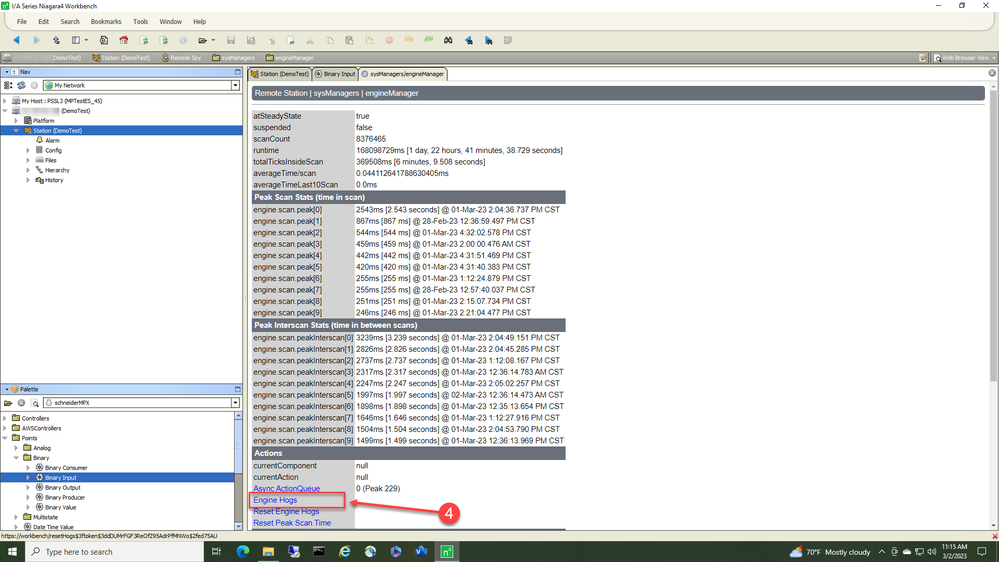
- Click "engineManager" and then scroll down
- to find "Engine Hogs". Clicking Engine Hogs will open a list of the main components of the station and a column on the right-hand side will display the average execution time of the component. Review the top 10 or so and see if any are taking an extraordinary amount of time. This can help to locate improperly executing objects.
- Driver Poll Rates
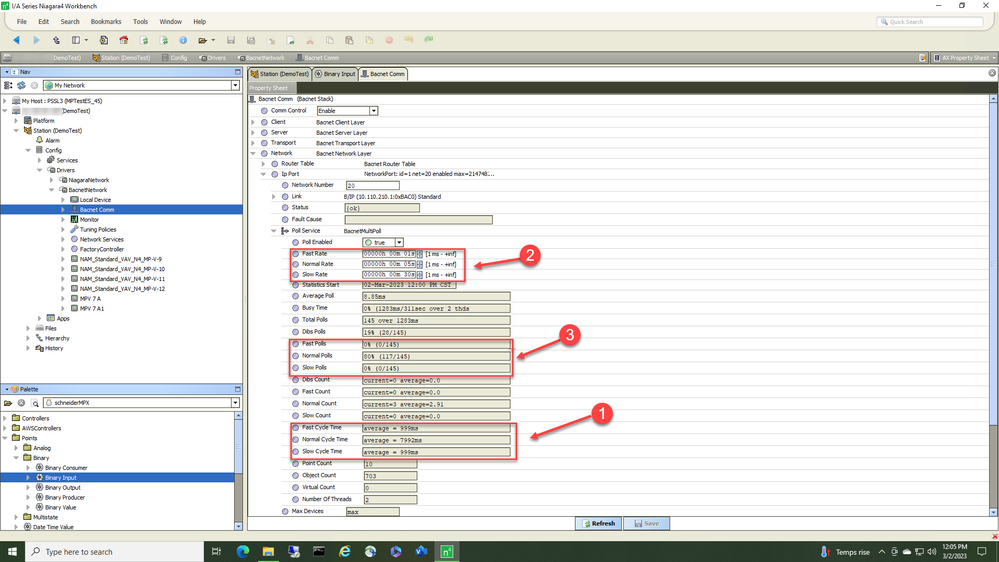
Drivers that are based on polling data, like BACnet when COV is not enabled, or Modbus constantly run commands to read data based on the fast, normal, and slow configured rates. Open the Poll Service under the network the points are being polled on.
Looking at the property sheet of the driver, it is important to verify that the cycle time (1) for each rate (fast/normal/slow) is always equal to, or below the actual time configured (2) for that rate. The defaults are 1 second for Fast Cycle Time, 5 seconds for the Normal Cycle Time and 30 seconds for the Slow Cycle Time. Seeing a longer cycle time is usually an indication that the network is saturated with commands and may cause the Jace/Niagara controller to be slow with heavy use of controller resources. There are several ways to correct this:
-
changing the polling rate
-
spreading the number of objects being polled at each rate, etc. In this example, all points (3) are in the "normal" bucket.
-
- Application Director console
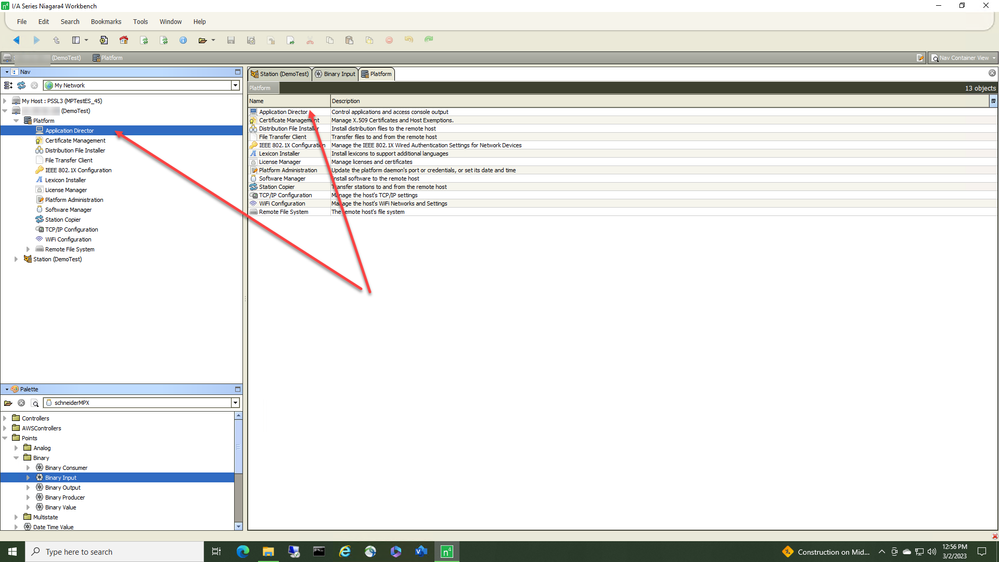
The "Application Director" (under "Platform") shows a live console output. Open it by clicking the option under the platform
Copy the content of the Application Director, or "stream to file" to send the content to support. It will be essential to help the support engineer to understand the problems in the station.
- Add more debug information to the Application Director console
You can add more granularity to the messages in the Application Director for a deeper look into possible issues. This can be accomplished in 2 different ways:
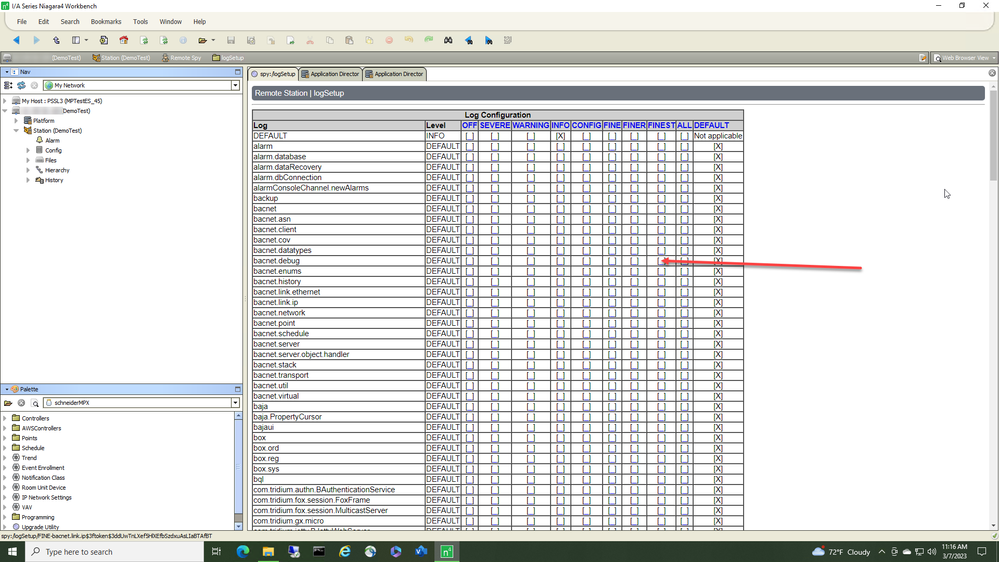
- Right-click on the station, and select "Spy". Then, select "logSetup" on the main view
From the list that appears, you can scroll and find appropriate topics to log and you can select at what level you want the information to appear. This will add traffic to the application Director window so be careful how "fine" and how many logs you enable. It might be good to consult with support before enabling these logs. example; bacnet.debug/finest if you select this box.
- Debug Service
- Select the "DebugService" from the station "Services"
- In the Log Category, type a few letters of the topic and scroll to find what you are interested in logging
- From the pulldown menu, determine the granularity of the log
- Click the plus
- Click "Save"
Setting this logging and streaming the output to a file will allow information to be sent to support for better diagnostics if required. Remember to set this logging back to "Default" when done so the Application Director is not overwhelmed with information when you are only trying to view normal station activity.
- Right-click on the station, and select "Spy". Then, select "logSetup" on the main view
