Help
  • Explore Community
  • Get Started
  • Ask the Community
  • How-To & Best Practices
  • Contact Support
Notifications
Login / Register
Community
Community
Notifications
close
  • Forums
  • Knowledge Center
  • Events & Webinars
  • Ideas
  • Blogs
Help
Help
  • Explore Community
  • Get Started
  • Ask the Community
  • How-To & Best Practices
  • Contact Support
Login / Register
Sustainability
Sustainability

Join our "Ask Me About" community webinar on May 20th at 9 AM CET and 5 PM CET to explore cybersecurity and monitoring for Data Center and edge IT. Learn about market trends, cutting-edge technologies, and best practices from industry experts.
Register and secure your Critical IT infrastructure

Data not showing in a single row on the Trend Log Comparison Report

Building Automation Knowledge Base

Schneider Electric Building Automation Knowledge Base is a self-service resource to answer all your questions about EcoStruxure Building suite, Andover Continuum, Satchwell, TAC…

cancel
Turn on suggestions
Auto-suggest helps you quickly narrow down your search results by suggesting possible matches as you type.
Showing results for 
Show  only  | Search instead for 
Did you mean: 
  • Home
  • Schneider Electric Community
  • Knowledge Center
  • Building Automation Knowledge Base
  • Data not showing in a single row on the Trend Log Comparison Report
Options
  • Bookmark
  • Subscribe
  • Email to a Friend
  • Printer Friendly Page
  • Report Inappropriate Content
Invite a Co-worker
Send a co-worker an invite to the portal.Just enter their email address and we'll connect them to register. After joining, they will belong to the same company.
You have entered an invalid email address. Please re-enter the email address.
This co-worker has already been invited to the Exchange portal. Please invite another co-worker.
Please enter email address
Send Invite Cancel
Invitation Sent
Your invitation was sent.Thanks for sharing Exchange with your co-worker.
Send New Invite Close

Related Forums

  • Intelligent Devices Forum

Previous Next
Contributors
  • Derrick_Ratliff
    Derrick_Ratliff
  • Product_Support
    Product_Support

Invite a Colleague

Found this content useful? Share it with a Colleague!

Invite a Colleague Invite
Back to Building Automation Knowledge Base
Options
  • Bookmark
  • Subscribe
  • Email to a Friend
  • Printer Friendly Page
  • Report Inappropriate Content
0 Likes
1325 Views

Link copied. Please paste this link to share this article on your social media post.

Trying to translate this page to your language?
Select your language from the translate dropdown in the upper right. arrow
Translate to: English
  • (Français) French
  • (Deutsche) German
  • (Italiano) Italian
  • (Português) Portuguese
  • (Русский) Russian
  • (Español) Spanish

Data not showing in a single row on the Trend Log Comparison Report

Picard Product_Support
‎2018-09-10 01:21 PM

Issue

Data not showing in a single row on the Trend Log Comparison Report

Creating Custom Reports

Environment

Report Builder 3.0

Struxureware Building Operation WebReports

Cause

Trend sample data is stored in the Reports Server at a resolution of less than 1 second. In some cases the user wants to compare data in showing less resolution than what is in stored in the database. 

Resolution

  1. Open Microsoft Report Builder and Edit the existing Trend Log Comparison Report.  You can get detailed instructions on how to perform this task on the online help guide.
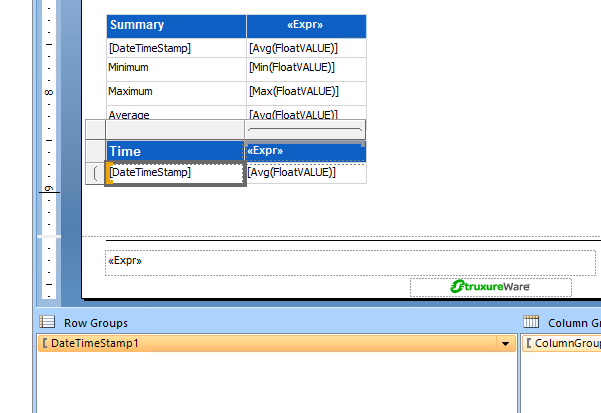
  2. Scroll to the bottom and select the DateTimeStamp Field in the Second Tablix object.
  3. Click on the drop down menu in the Row Groups pane and select Group Properties
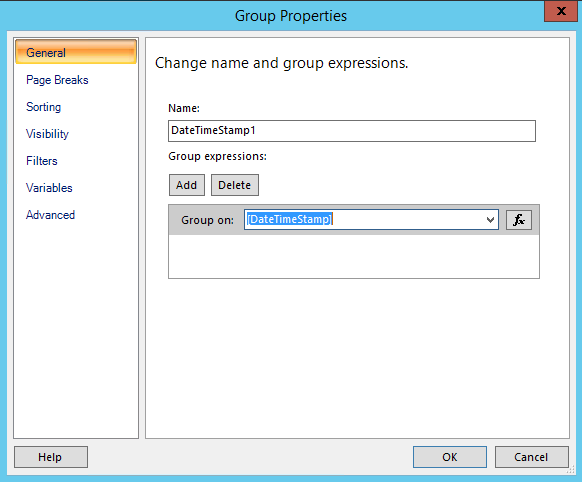
  4. On the General Tab, click on the Fx button
  5. Change the Expression to say: =FORMAT(Fields!DateTimeStamp.Value, "dd MM yyyy hh:mm")
  6. Repeat this for the Sorting Tab. Enter the same Expresssion. =FORMAT(Fields!DateTimeStamp.Value, "dd MM yyyy hh:mm")
  7. Click OK to save changes.
  8. Right click on the DateTimeStamp TextBox and select Text Box Properties.
  9. In the Number tab, change the default format to the desired display format
  10. Perform a Save AS to ensure you do not overwrite the factory supplied report. 
  11. Follow the instructions on web help to allow the modified report to be used in WebReports.
Labels (1)
Labels:
  • EcoStruxure Building Operation
Tags (1)
  • Find more articles tagged with:
  • 18798
Was this article helpful? Yes No
No ratings

Link copied. Please paste this link to share this article on your social media post.

To The Top!

Forums

  • APC UPS Data Center Backup Solutions
  • EcoStruxure IT
  • EcoStruxure Geo SCADA Expert
  • Metering & Power Quality
  • Schneider Electric Wiser

Knowledge Center

Events & webinars

Ideas

Blogs

Get Started

  • Ask the Community
  • Community Guidelines
  • Community User Guide
  • How-To & Best Practice
  • Experts Leaderboard
  • Contact Support
Brand-Logo
Subscribing is a smart move!
You can subscribe to this board after you log in or create your free account.
Forum-Icon

Create your free account or log in to subscribe to the board - and gain access to more than 10,000+ support articles along with insights from experts and peers.

Register today for FREE

Register Now

Already have an account? Login

Terms & Conditions Privacy Notice Change your Cookie Settings © 2025 Schneider Electric

This is a heading

With achievable small steps, users progress and continually feel satisfaction in task accomplishment.

Usetiful Onboarding Checklist remembers the progress of every user, allowing them to take bite-sized journeys and continue where they left.

of